Advancing Statistical Literacy in Eye Care: A Series for Enhanced Clinical Decision-Making
Part 1: Introduction to Statistical Tools for Eye Care ResearchPurpose. Advancements in eye and vision care hinge on the rigorous application of research and the precise interpretation of clinical data. However, the field of Eye and Vision Research (EVR)frequently encounters research waste attributed to methodological flaws and improper statistical analyses, undermining the validity of studies and inefficiently utilising substantial financial resources. This paper, the first instalment in the series “Advancing Statistical Literacy in Eye Care: A Series for Enhanced Clinical Decision-Making,” aims to address these challenges by enhancing the statistical literacy of eye care professionals.
Material and Methods. Through a comprehensive narrative literature review and the generation of simulated clinical datasets, this study identifies essential statistical concepts, common pitfalls, and best practices pertinent to EVR. The literature review used multiple databases, including PubMed, Scopus, and Web of Science, focusing on peer-reviewed articles and professional textbooks relevant to statistical methodologies. Simulated datasets reflecting realistic clinical measurements, such as pupil diameter, refractive error, central corneal thickness, and intraocular pressure, were created using Python (V3.12.4) to illustrate key statistical principles and their applications.
Results. The paper explores fundamental statistical concepts, including data types (nominal, ordinal, metric), data preparation techniques, handling missing data and outliers, and applying descriptive statistics. Additionally, it explores data distribution characteristics, normality assessment, and data transformation methods to ensure robust and reliable statistical analyses. By bridging theoretical knowledge with practical examples, this instalment seeks to equip eye care professionals with the tools to critically evaluate research, integrate evidence-based practices, and contribute meaningfully to the scientific community.
Conclusion. This study establishes a foundational framework to enhance statistical literacy among eye care professionals by exploring essential statistical concepts and best practices in EVR. By addressing common methodological flaws and improper analyses, it aims to reduce research waste and improve the validity of studies. Ultimately, this initiative is expected to promote more accurate data interpretation, better clinical decision-making, and improved patient care in the field of eye and vision health.
Introduction
Advancements in eye and vision care depend on rigorous research and precise clinical data interpretation. As eye care professionals navigate an ever-expanding body of scientific literature, understanding and applying appropriate statistical methods cannot be overstated. Statistical literacy is essential for critically evaluating research, integrating evidence-based practices, and contributing to the scientific community.
Evidence-based practice is essential to eye and vision care, guiding diagnosis, treatment, and overall patient care through high-quality research supported by sound statistical methods.1-5 However, the field faces significant challenges due to studies often plagued by methodological flaws, and improper statistical analysis, which undermine research validity and contribute to unnecessary use of resources on studies that fail to yield reliable findings (research waste).3-5
Research waste in ophthalmology is a severe issue, leading to inefficiencies and resource waste.5 For instance, only 22.4 % of phase III ophthalmology trials cite systematic reviews as a justification for the study, missing opportunities to build on existing evidence and resulting in redundant research.6 In surgical studies, the problem is exacerbated by poor methodological rigour, often resulting in incomplete or invalid findings. Estimates suggest that up to 85 % of global health research, representing a substantial portion of the $ 200 billion annual expenditure, may be wasted due to non-publication, unclear reporting and lack of systematic review use in study design.7-9 In EVR, this waste commonly stems from inadequate sample sizes, inappropriate statistical tests, or misinterpreting results.7-9 A review of ophthalmic literature found a substantial portion of published studies contained statistical inaccuracies, further eroding research credibility and slowing the progression of evidence-based practice.8-10
Improving statistical literacy among researchers and clinicians is crucial to addressing these issues. A solid understanding of statistical principles and correct application can enhance research quality, reduce waste, and support evidence-based patient care through reliable and valid findings.
Methods
This article is the first instalment in a five-part series designed to enhance statistical literacy among eye care professionals. To accomplish this, a two-pronged methodological approach was employed: a comprehensive literature review and the creation of simulated datasets to exemplify key statistical concepts pertinent to Eye and Vision Research (EVR).
A narrative literature review was conducted to identify essential statistical concepts, common pitfalls, and best practices in applying statistical methods within EVR. The literature search was performed across multiple databases, including PubMed, Scopus, and Web of Science, covering publications up to October 2024.
Keywords and Search Terms: The search utilised combinations of terms such as “vision science“, “statistical methods“, “data analysis“, “clinical research“, “biostatistics“, “eye care“, “research methodology“, “data distribution“, “missing data“, “outliers“, and “statistical literacy“.
Inclusion Criteria: We included peer-reviewed articles and professional textbooks that focused on statistical methods applicable to ophthalmology and optometry, studies highlighting common statistical errors in EVR, guidelines on best practices for data analysis in clinical research, and articles emphasising the importance of statistical literacy in eye care.
Exclusion Criteria: Articles not directly related to statistical methods in eye care, non-English publications, conference abstracts without full texts, and studies lacking methodological details were excluded.
Data Extraction and Synthesis: Relevant articles were initially selected based on title and abstract screening, followed by full-text reviews. Key information extracted included statistical concepts discussed, common errors identified, recommendations for best practices, and implications for clinical decision-making. The findings were synthesised thematically to provide a comprehensive overview of fundamental statistical concepts, data types, data preparation, and descriptive statistics relevant to eye care professionals.
Simulated Data Generation: To provide practical examples and visual illustrations of the statistical concepts discussed, we generated simulated datasets using Python (V3.12.4). The datasets were crafted to reflect realistic clinical data commonly encountered in EVR, focusing on pupil diameter (n = 1000), refractive error (n = 1000), and central corneal thickness and intraocular pressure (CCT, IOP, n = 1000). The data were modelled to follow a given distribution with parameters (mean and standard deviation) reflective of typical clinical observations (pupil size,12-17 refractive error,18-24 CCT and IOP 25,26,27,28,29,30).
Data Generation Process: Data generation and analysis were performed using Python and libraries such as NumPy (V2.0.1)31 for numerical computations, pandas 32 for data manipulation, and matplotlib 33 and seaborn 34 for data visualisation. The simulated datasets were generated using statistical models appropriate for each variable. For example, normal distributions were used for pupil diameter, while refractive error data were modelled to exhibit skewness akin to real-world clinical data.
The simulated datasets are available through the Open Science Framework (OSF) at DOI: 10.17605/OSF.IO/6EYMW,35 ensuring transparency and allowing readers to replicate the analyses presented.
As the study involved simulated data and a review of existing literature, no ethical approval was required. The simulated data do not represent real patient information, eliminating patient confidentiality and privacy concerns.
By combining a thorough literature review with the creation of simulated clinical datasets, the article bridges theoretical knowledge and practical application. This integrative approach is intended to enhance understanding and facilitate the application of statistical tools in clinical decision-making in eye care.
Fundamental statistical concepts
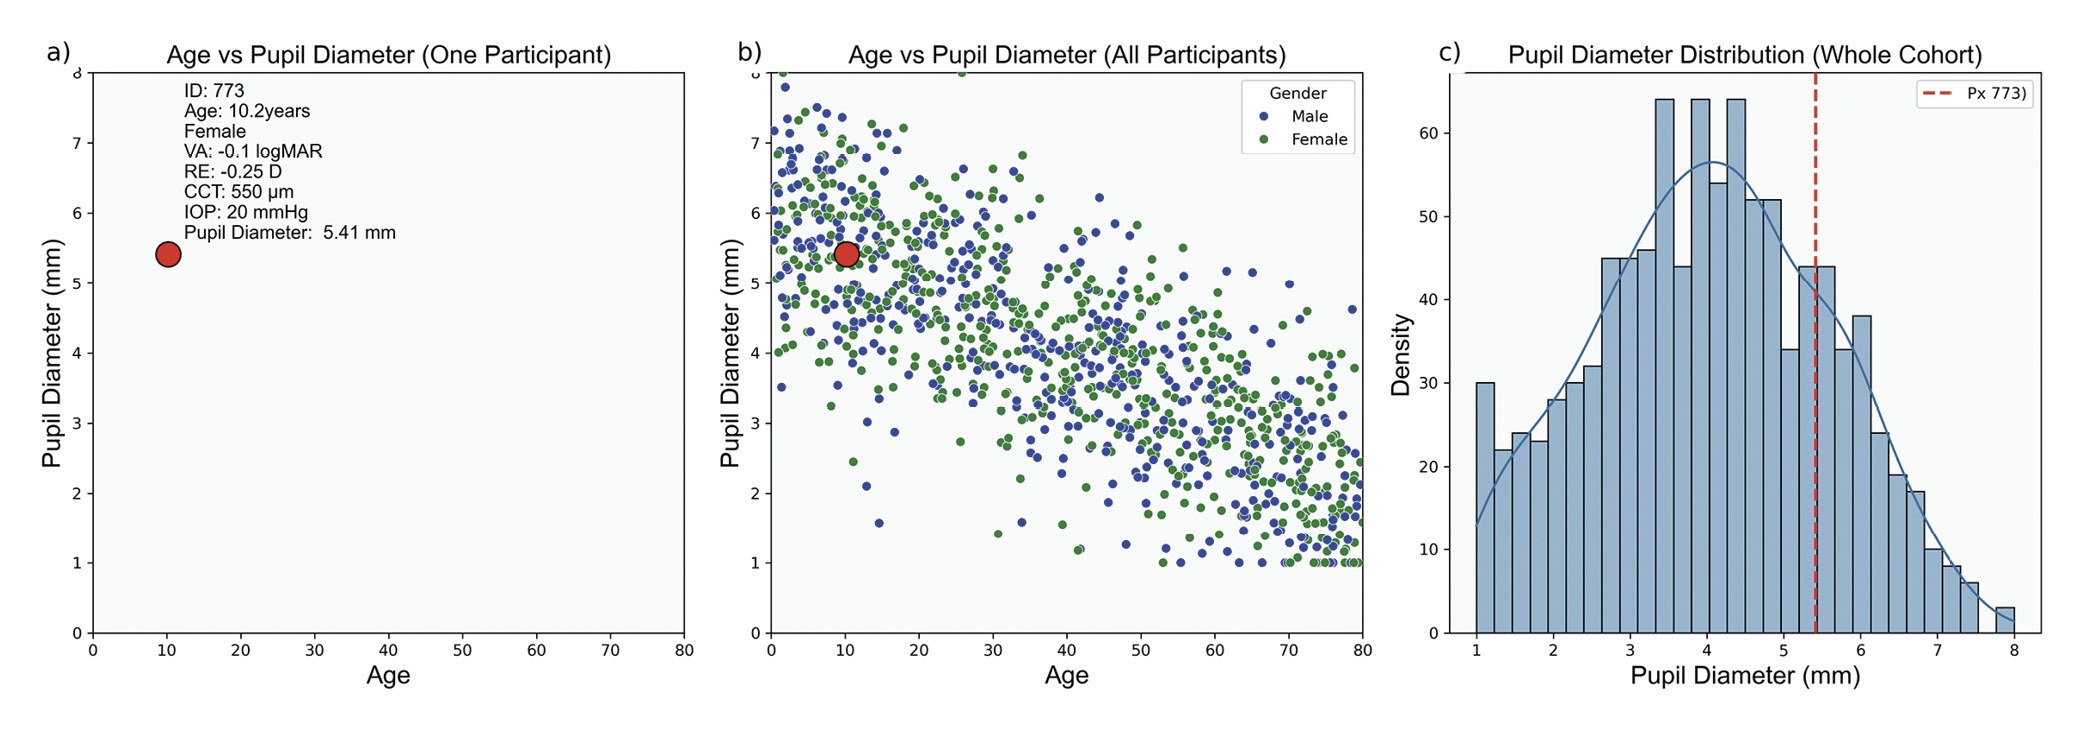
Interpreting cohort findings begins with collecting individual data points from a sample representing the target population. Each data point, such as pupil diameter (Figure 1), provides specific information about a single subject. When aggregated, these data points create a dataset that reflects the characteristics and variability of the broader population.
Biological measurements inherently carry uncertainty and variability due to individual biological differences, environmental influences, and measurement errors. Uncertainty reflects confidence in measurement accuracy and conclusions, while variability pertains to natural data fluctuations. Thus, data collection alone is insufficient. Statistics provides the tools to quantify uncertainty and assess variability, enabling researchers to distinguish between random fluctuations and meaningful patterns. By applying statistical techniques, researchers can make informed inferences about the population, assess the reliability of the findings and estimate the likelihood that observed effects are due to chance.
Data is not monolithic, varying by the nature of what is measured and the measurement technique used. Each data type requires specific analytical methods. In EVR, data is primarily empirical and derived from observation and experimentation. It can be categorised as nominal (e. g., type of cataract), ordinal (e. g., visual acuity), and metric (e. g., axial length), Table 1. Additionally, data can be defined by the values a variable can assume; continuous data spans a range limited only by measurement precision, while discrete data is restricted to specific, separate values, typically representing counts or whole numbers.
Data Preparation
Preparing the data for analysis is essential for accurate results and involves exploration, transformation and validation. Data exploration allows the researcher to understand how the data will be used and determine how to clean, structure and organise it. Transformation includes structuring the data, organising it relationally, and normalising it by removing redundancies. Cleaning addresses irregularities, including missing values, inaccuracies and outliers.36
Implementing validation rules, such as range and consistency checks, during data entry reduces error rates. Regular audits identify anomalies, and duplicate detection prevents double-counting of data points. Effective data management, including Standard Operating Procedures (SOPs) for data collection, entry, and storage, ensures consistency and reliability. Training personnel and using Electronic Data Capture (EDC) systems with validation tools further improve data quality. Additionally, statistical quality control measures, such as control charts and process capability analysis, monitor data collection over time, detect shifts or trends that may signal quality issues and ensure adherence to quality standards.36,37

Missing Data
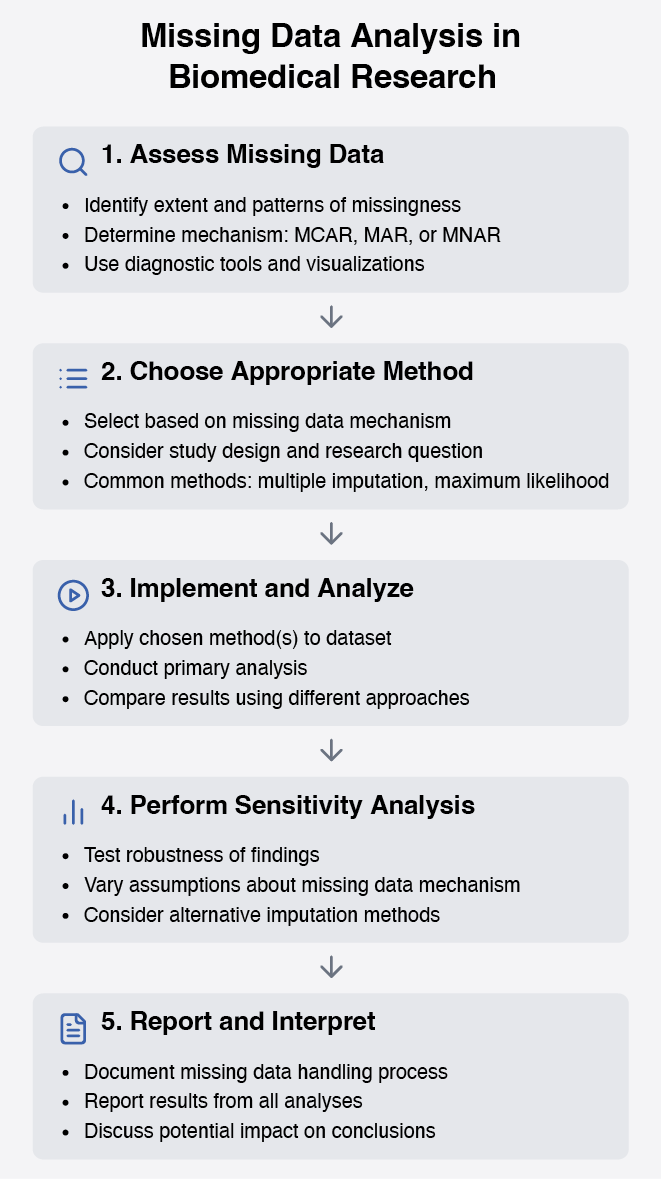
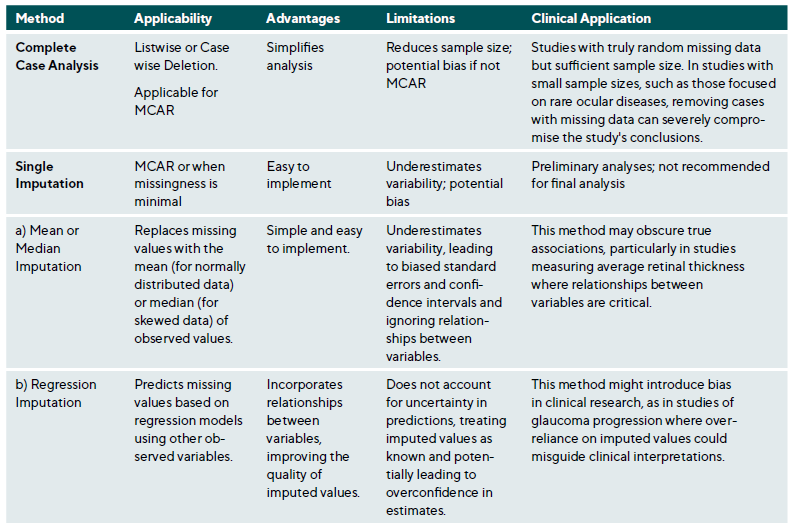
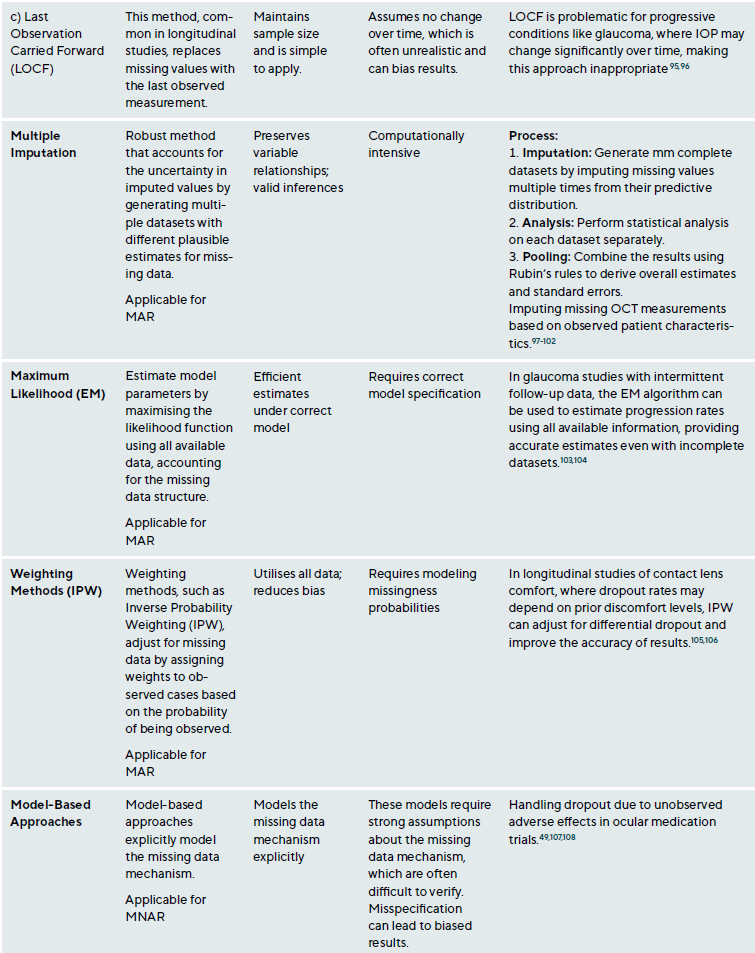
Missing data is a common research issue that can introduce bias, reduce statistical power, and compromise study generalisability. In clinical research, missing data may result from patient dropouts, non-compliance, technical issues during data collection, or data entry errors. Addressing missing data requires understanding the underlying mechanisms and applying suitable statistical methods.38,39 Missing data falls into three categories: Missing Completely At Random (MCAR), Missing At Random (MAR) and Missing Not At Random (MNAR),40 Table 2. The choice of method depends on the type of missingness and study context, Table A1. Figure 2 presents a step-by-step approach for addressing missing data.
Outliers
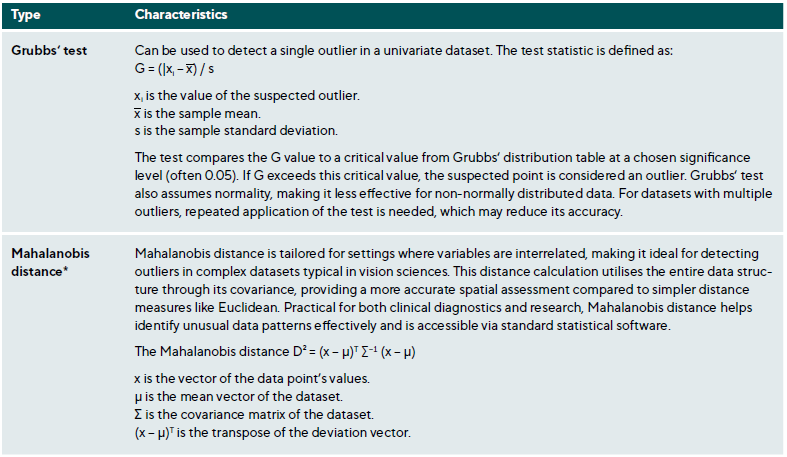
Outliers are data points that deviate significantly from the dataset and may arise from measurement errors, data entry mistakes, or true extreme values due to biological variability or rare conditions. Identifying and appropriately managing outliers is essential to maintaining data integrity and valid statistical analysis.45,46 Table 3 summarises various methods for outlier detection along with their applications and limitations.
After detecting outliers, they should be carefully examined and managed. The first step is verification, involving checks for data entry errors or measurement inaccuracies, such as typographical mistakes or instrument calibration issues. Determining if the outlier is clinically plausible or represents an extreme physiological condition is also important.45,46
Researchers have several options for handling outliers. Retaining them is appropriate if they represent valid observations, though this may increase variability and affect statistical robustness. Conversely, excluding outliers is justified if they are errors or do not represent the studied population, with predefined exclusion criteria to prevent bias. Alternatively, data transformations (e. g., logarithmic) can reduce the influence of outliers without removal, and robust methods, such as least absolute deviations (LAD) or M-estimators, minimise the influence of extreme values on the analysis.48
Outliers can significantly impact clinical research and practice. They may sometimes represent novel findings, such as rare clinical presentations that warrant further investigation. For instance, an unusually early onset of age-related macular degeneration (AMD) could reveal insights into atypical disease progression or unique risk factors. However, outliers can also distort statistical analyses, leading to erroneous conclusions. Extreme values can skew parameter estimates, compromising study validity. This is particularly relevant in risk stratification, where identifying outliers can help identify high-risk patients who may need special interventions. In clinical settings, outliers often underscore important considerations. For example, in visual field testing, a subset of glaucoma patients with unusually rapid progression may indicate non-compliance with the treatment or a more aggressive disease variant requiring closer monitoring.49-52 Likewise, an unusually long axial length in biometric measurements may suggest pathological myopia, prompting further investigation or treatment adjustments.53,54


Descriptive Statistics
Descriptive statistics are fundamental tools that summarise and organise data without making inferences or predictions, providing a snapshot of a dataset’s key features. In EVR, where data ranges from biometric measurements to patient-reported outcomes, descriptive statistics help distil complex information into clear, interpretable metrics.
Measures of Central Tendency
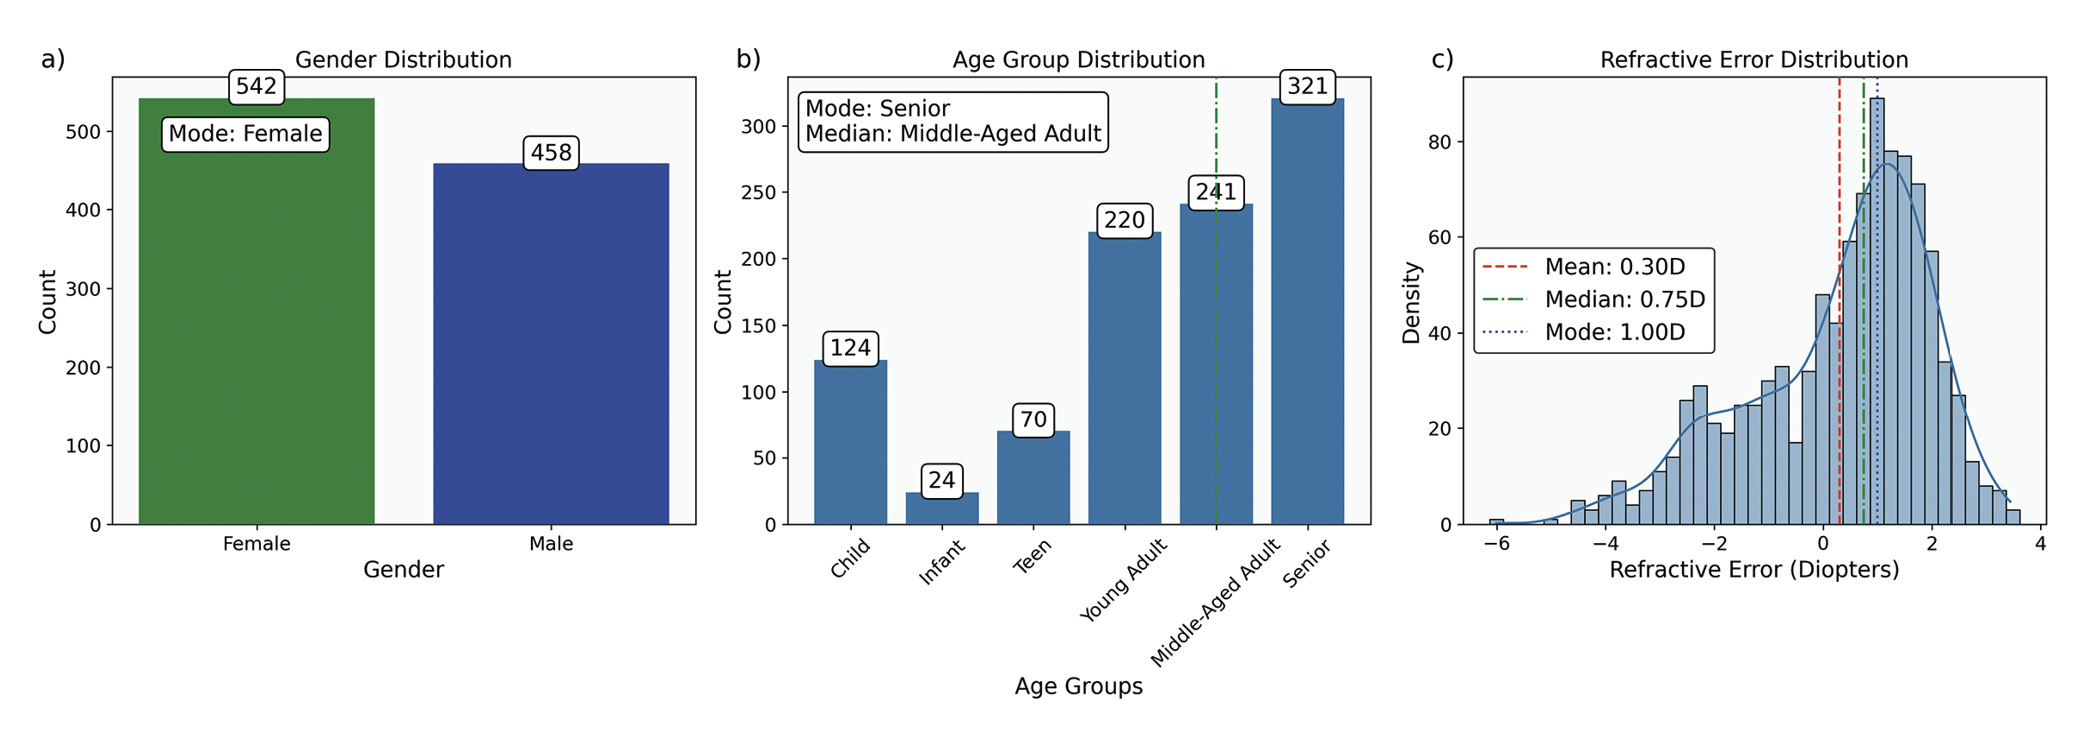
Measures of central tendency identify the central point around which data values cluster. The primary measures are the mean, median, and mode, each providing unique insights, especially when analysing ophthalmic data with specific distribution characteristics, Table 4 and Figure 3.
In multicentre studies or meta-analyses, where data originates from various sources with different sample sizes, the weighted mean can account for these differences among studies, yielding a more accurate overall estimate. When data is log-normally distributed or involves growth rate, such as bacterial counts 60 in ophthalmic infections, the geometric mean provides a more suitable measure of central tendency.

Measures of Dispersion
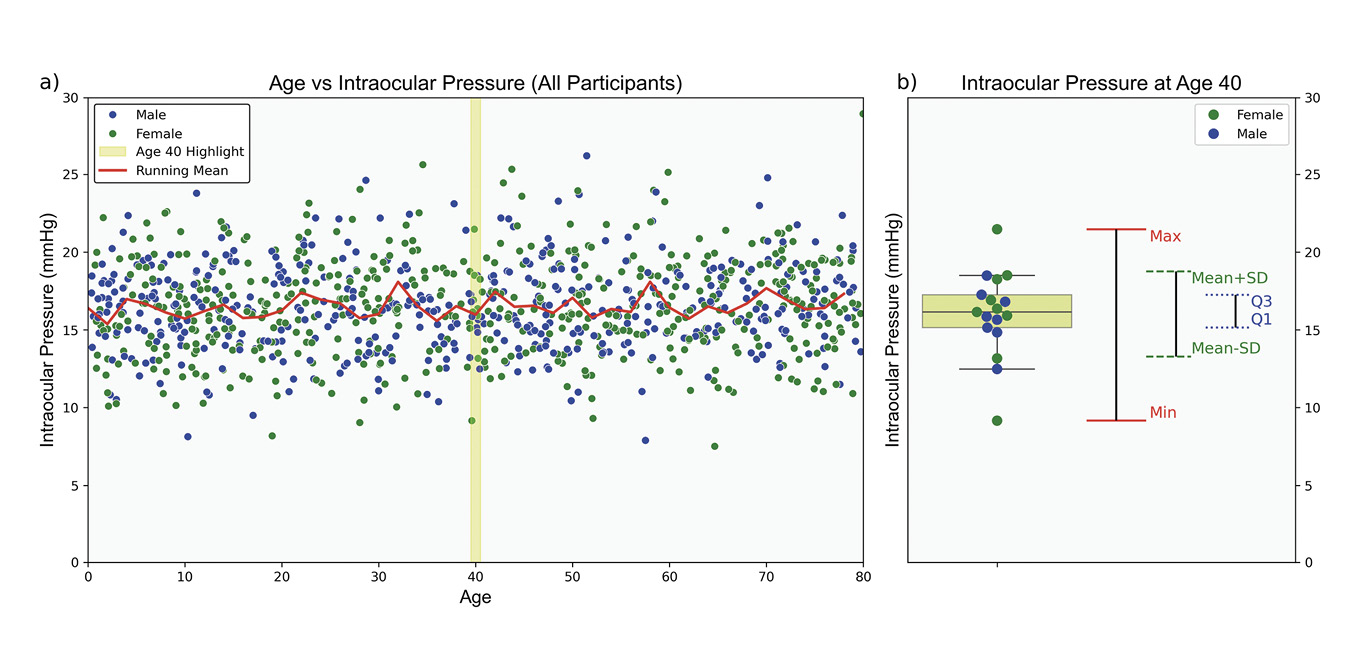
Measures of dispersion quantify variability within a dataset, complementing central tendency measures by providing insight into data homogeneity, Table 5. Homogeneity refers to the degree of similarity or uniformity among data points.61 In clinical settings, understanding population variability is essential for interpreting individual measurements. For instance, IOP data for individuals aged 0 to 80 tends to cluster around an age-specific mean, Figure 4. However, central tendency measures alone do not capture the variability within the cohort. Measures of dispersion are essential in estimating the range of values an individual might exhibit, influenced by the data scale and the nature of the measurements.
Data Distribution Characteristics
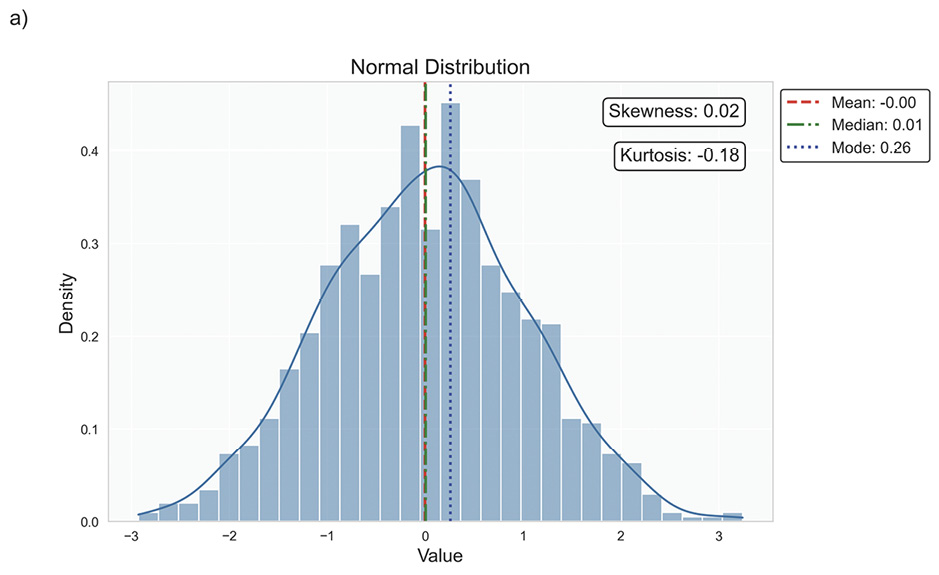
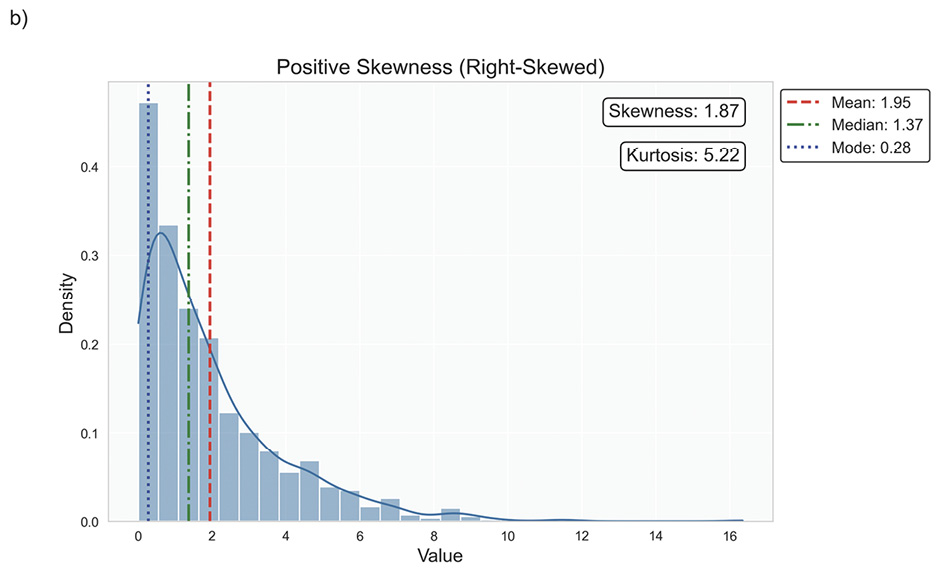
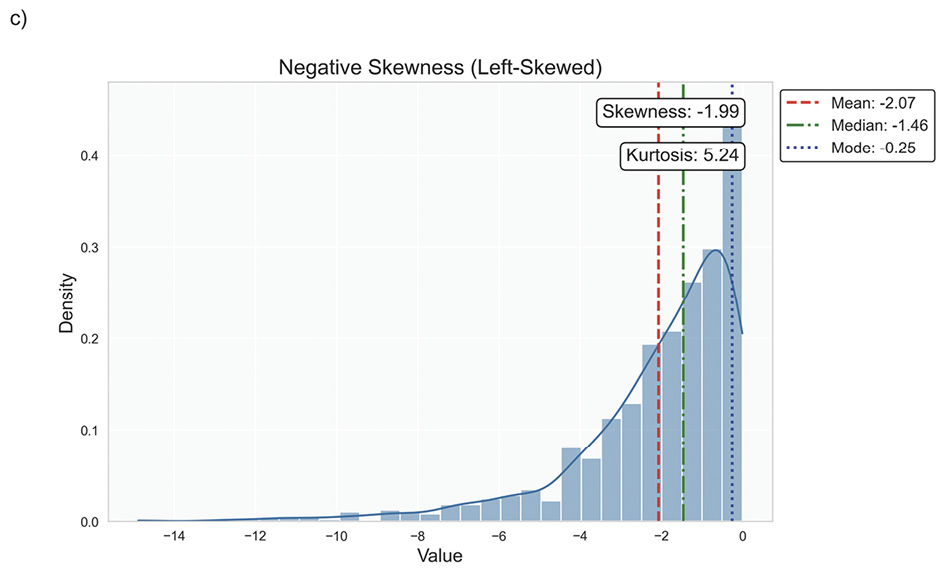
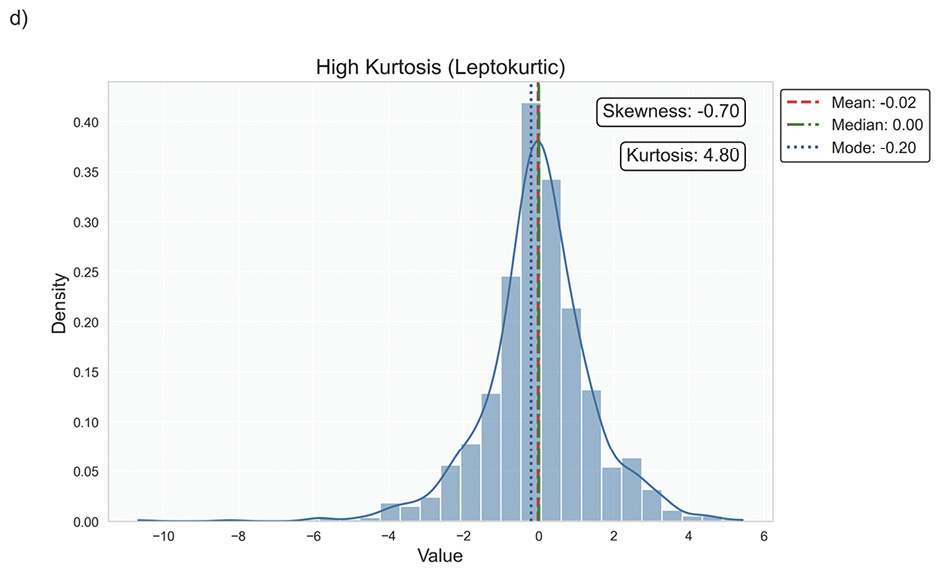
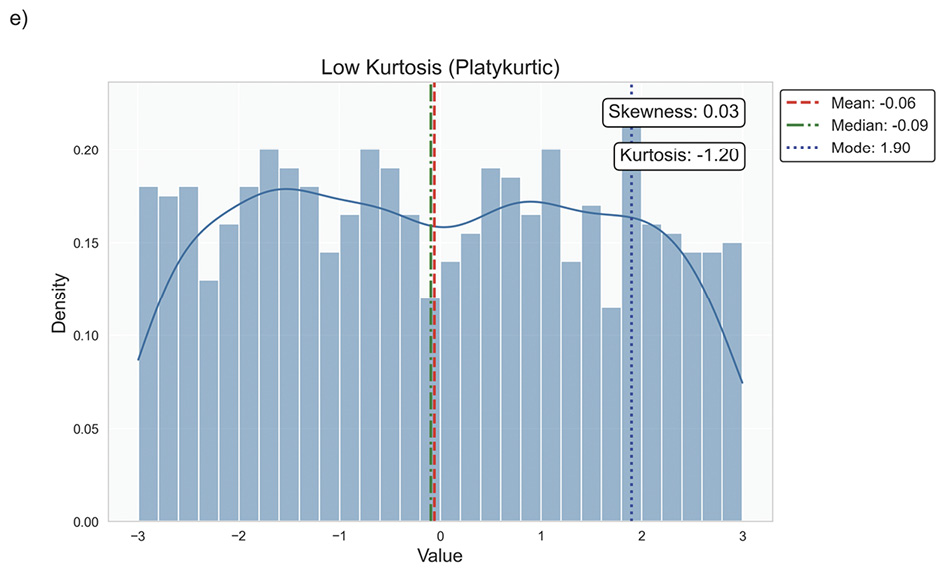
Data distribution is critical for selecting appropriate statistical methods and interpreting results accurately, as it describes how data points are spread across various values in a dataset. It provides a statistical overview of frequency and likelihood for measurements, guiding expectations and informing clinical decision-making.69 Understanding the distribution helps determine if assumptions like normality hold, influencing the validity of results. Key properties include central tendency, dispersion, skewness, and kurtosis, which together characterise the shape, spread, and extremities of the data. Skewness measures asymmetry around the mean, indicating if data clusters more on one side, while kurtosis quantifies the sharpness of a distribution’s peak, reflecting its propensity to produce outliers. Figure 5 illustrates various distribution scenarios, and Table 6 summarises the types of skewness and kurtosis with clinical examples.
Skewness can be categorised based on thresholds as approximately symmetric (skewness between −0.5 and 0.5), moderately skewed (between −1 and −0.5 or between 0.5 and 1) and highly skewed (below −1 or above 1). These thresholds may vary by field of study, so it is important to consider skewness in the context of data and analysis goals. Skewed data may violate assumptions of parametric statistical tests, which generally assume normal (symmetrical) distributions. Data transformation (e. g., logarithmic) or non-parametric statistical methods may be necessary for valid results. Kurtosis helps assess outlier risk; for instance, in clinical trials, a leptokurtic distribution in outcomes may prompt additional scrutiny of extreme values, ensuring they are genuine observations, not errors. It also informs statistical choices, as some tests are more robust to kurtosis deviations.


Data Normality
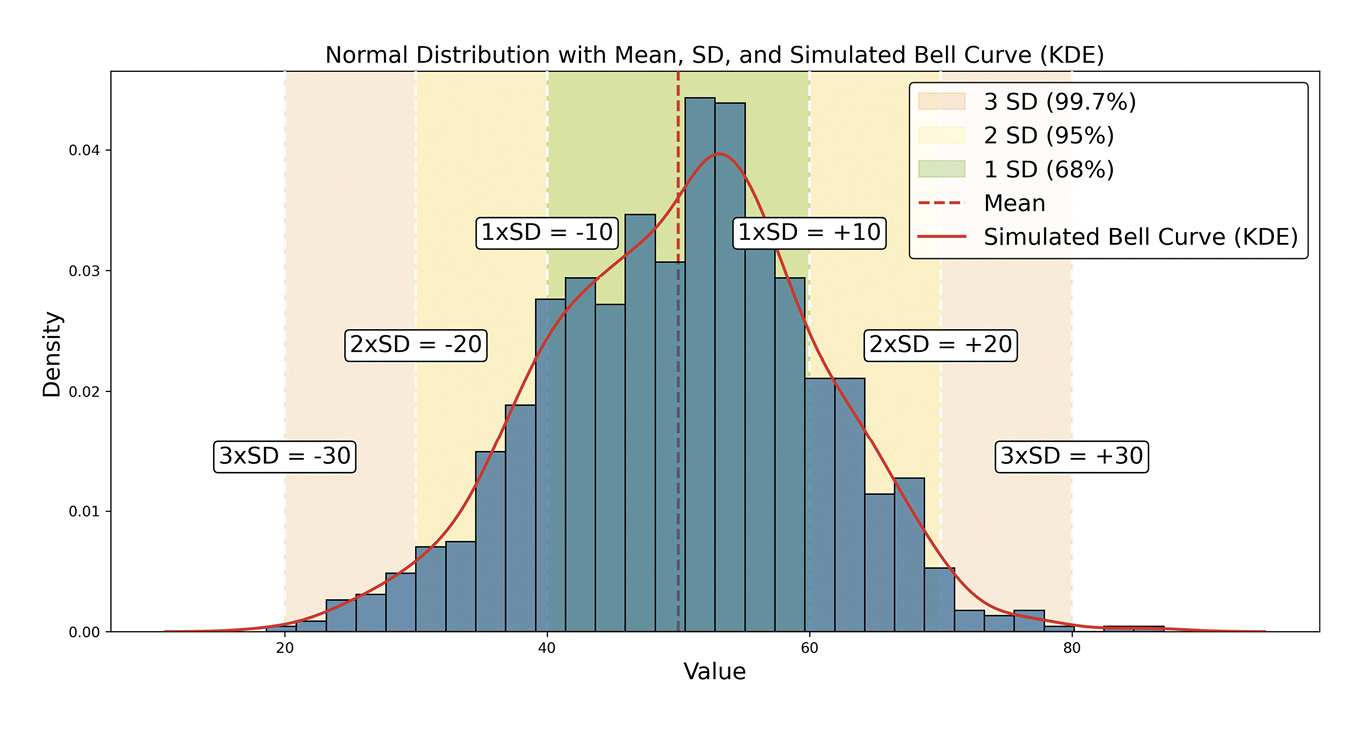
Understanding data distribution is fundamental in statistics, as it guides the selection of statistical tests and the validity of inferences drawn from the data.70 The normal, or Gaussian, distribution is particularly central to statistical theory and practice, especially in EVR. A symmetrical, bell-shaped curve characterises this continuous distribution centred around the mean with a defined standard deviation, Figure 6.
The normal distribution applies to continuous interval or ratio scale data. In EVR, many biometric measurements, such as corneal thickness, axial length and visual acuity in logMAR units, are ratio-scaled continuous data and can be modelled using the normal distribution,78 provided they meet criteria for symmetry and lack of significant kurtosis. The normal distribution is foundational in statistical analysis, underpinning several fundamental methods, especially parametric tests like t-tests, analysis of variance (ANOVA), and linear regression, which assume normally distributed data or residuals. Violation of this assumption may lead to inaccurate results.
A related and critical concept is the Central Limit Theorem (CLT), which states that as the sample size increases, the distribution of sample means approaches normality, regardless of the population’s original distribution. This principle enables researchers to use normal-based inferences with large samples, even if the underlying data are non-normal.79
The normal distribution is also essential for statistical inference, particularly when calculating confidence and prediction intervals. These intervals allow for accurate estimation of population parameters and prediction of future observations. They rely on normal distribution properties, which ensure reliable inferences. Lastly, the normal distribution facilitates standardisation, where z-scores (Table 3) measure the distance of a data point from the mean in standard deviation units. This standardisation compares across different scales or distributions.
Assessing Normality
Various graphical and statistical methods can be used to assess normality, each with distinct strengths and limitations. Combining graphical and statistical approaches (Table 7) provides a more robust assessment of data normality.70
Histograms: Histograms provide a straightforward representation of data frequency distributions. An asymmetric, bell-shaped curve generally indicates normality; however, interpreting histograms can be subjective, particularly with smaller samples where the distribution shape may be unclear. Additionally, histograms may not reveal subtle deviations from normality.
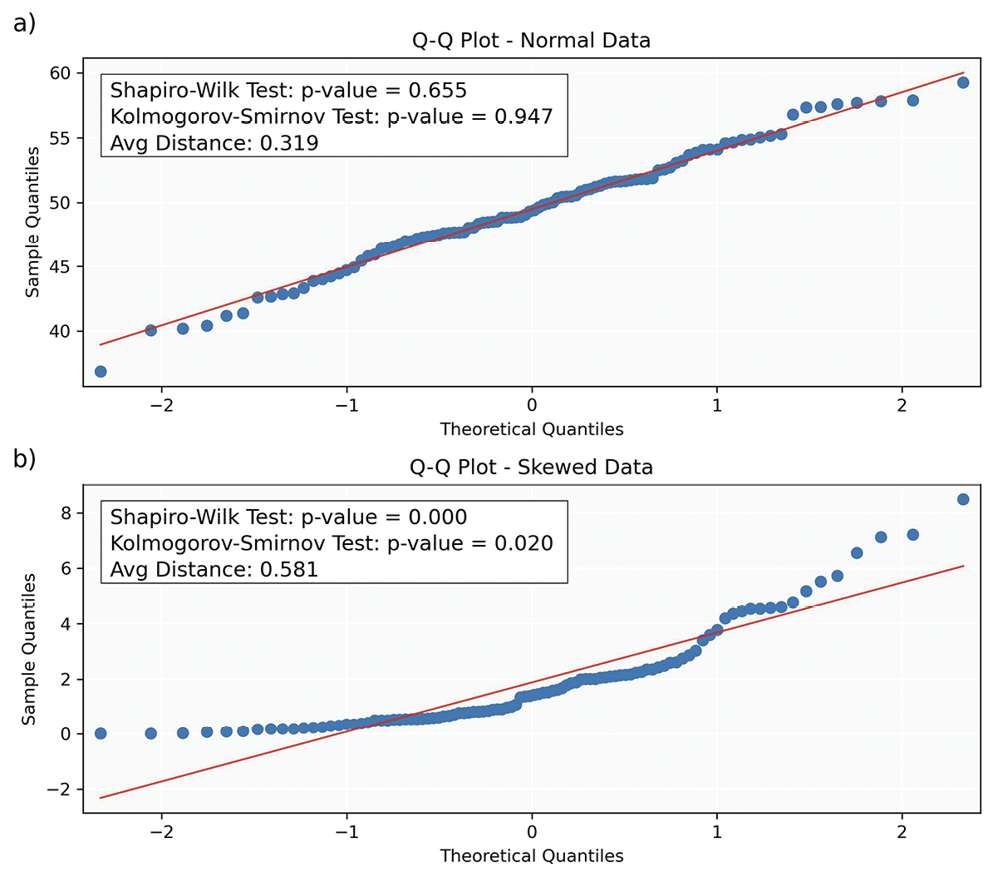
Q-Q (Quantile-Quantile) Plots: Q-Q plots compare the quantiles of the sample data to those of a theoretical normal distribution, providing insight into data distribution and identifying outliers, skewness and kurtosis. The x-axis represents theoretical quantiles from a reference distribution (e. g., normal distribution), while the y-axis shows the quantiles of the sample data. Each point corresponds to a quantile of the dataset plotted against a quantile of the reference distribution. To assess normality, the (Euclidean) distance between each data point and the corresponding point on the diagonal (representing the ideal case for a normal distribution) is calculated in Figures 8a and 8b.
Typical Q-Q plot scenarios include:
• Straight Line: If the points align closely along the diagonal, the sample data likely follows a normal distribution.
• Upward or Downward Curvature: Indicates right (upward) or left (downward) skewness, respectively.
• S-shaped Curve: Suggests heavy tails in the data, indicating more extreme values than expected in a normal distribution.
• Outliers: Points far from the line represent outliers or significant deviations from the expected distribution.
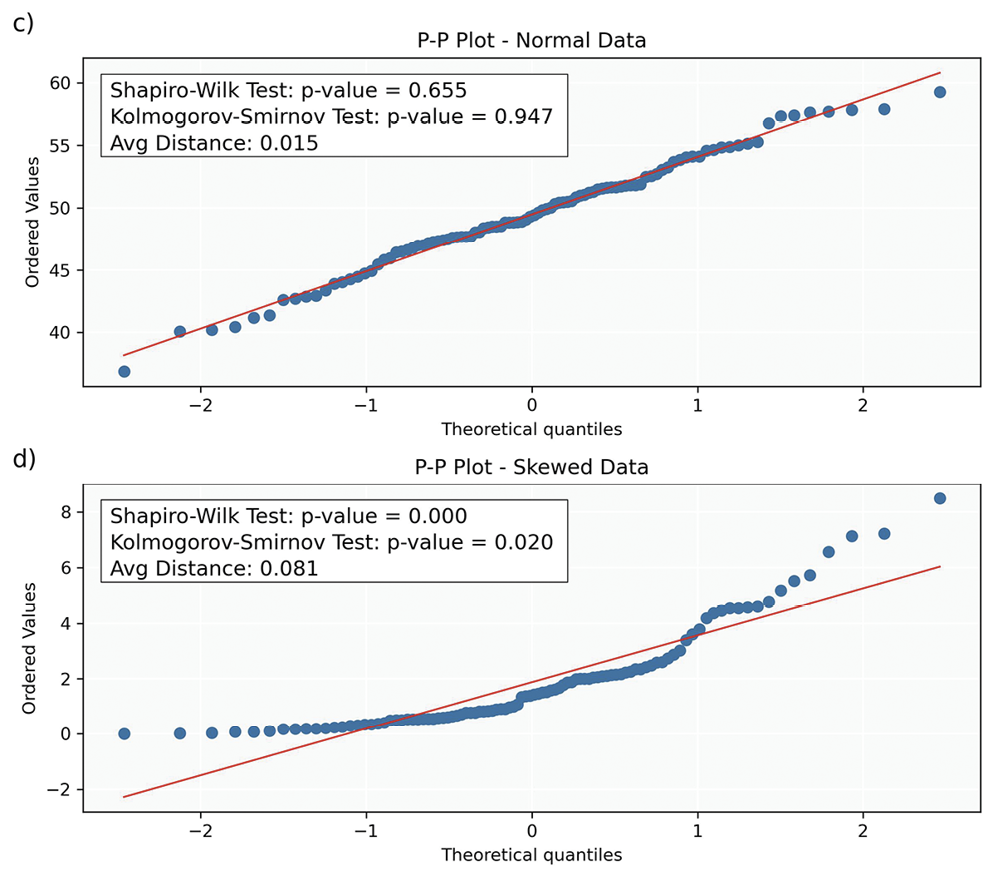
P-P (Probability-Probability) Plots: P-P plots display the cumulative probabilities of the sample data (y-axis) against those of a normal distribution (x-axis). Each data point on a P-P plot represents the probability of a sample data point plotted against its corresponding probability from a theoretical distribution. Deviations from the line suggest violations of normality, similar to those described for Q-Q plots. While Q-Q plots provide information about the shape of the distribution, P-P plots assess how well the overall probabilities align between the theoretical and sample distributions. Additionally, P-P plots are less sensitive to deviations in the tails of the distribution compared to Q-Q plots.
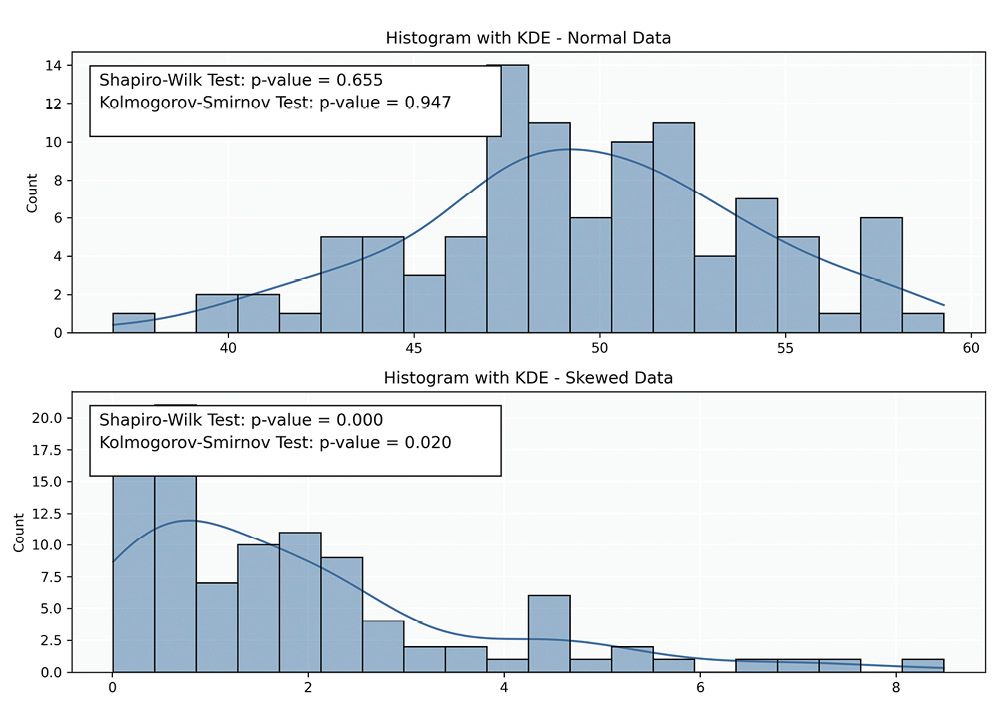
Statistical Tests: While statistical tests (Table 7) provide valuable insights into the normality of data, they have limitations. A primary challenge is their sensitivity to sample size; in small samples, these tests may lack the power to detect non-normality (low power), while in large samples, they may identify trivial deviations as significant (over-sensitivity). Consequently, relying solely on statistical tests can be misleading, especially when combined with other tests assuming normality. This highlights the importance of employing graphical and statistical methods to understand the data distribution comprehensively.
Clinical Implications and Meaningfulness of Normality
Assumption of normality significantly impacts clinical research and practice, directly influencing the validity of statistical tests. Incorrectly assuming normality can lead to invalid results, ultimately influencing clinical decisions. For instance, diagnostic thresholds, such as reference ranges for retinal nerve fibre layer thickness, are based on the normal distribution to identify pathological conditions accurately.81,82 Deviations from this assumption can result in misclassification of patients, affecting diagnosis and treatment.
In personalised medicine, understanding the distribution of biomarkers, like IOP or central corneal thickness, enables clinicians to tailor interventions to individual patient profiles. A comprehensive understanding of how these biomarkers are distributed within populations informs individualised treatment plans, accounting for patient variability and ensuring more precise, targeted therapeutic approaches.83,84
The importance of ensuring normality in clinical data is particularly evident in treatment efficacy studies. For instance, confirming that IOP reduction measurements are normally distributed in a clinical trial evaluating a new glaucoma medication is critical for valid comparisons using parametric tests.85 Accurate statistical analysis facilitates evidence-based decisions regarding the treatment‘s efficacy, ultimately determining its adoption in clinical practice.

Data transformation
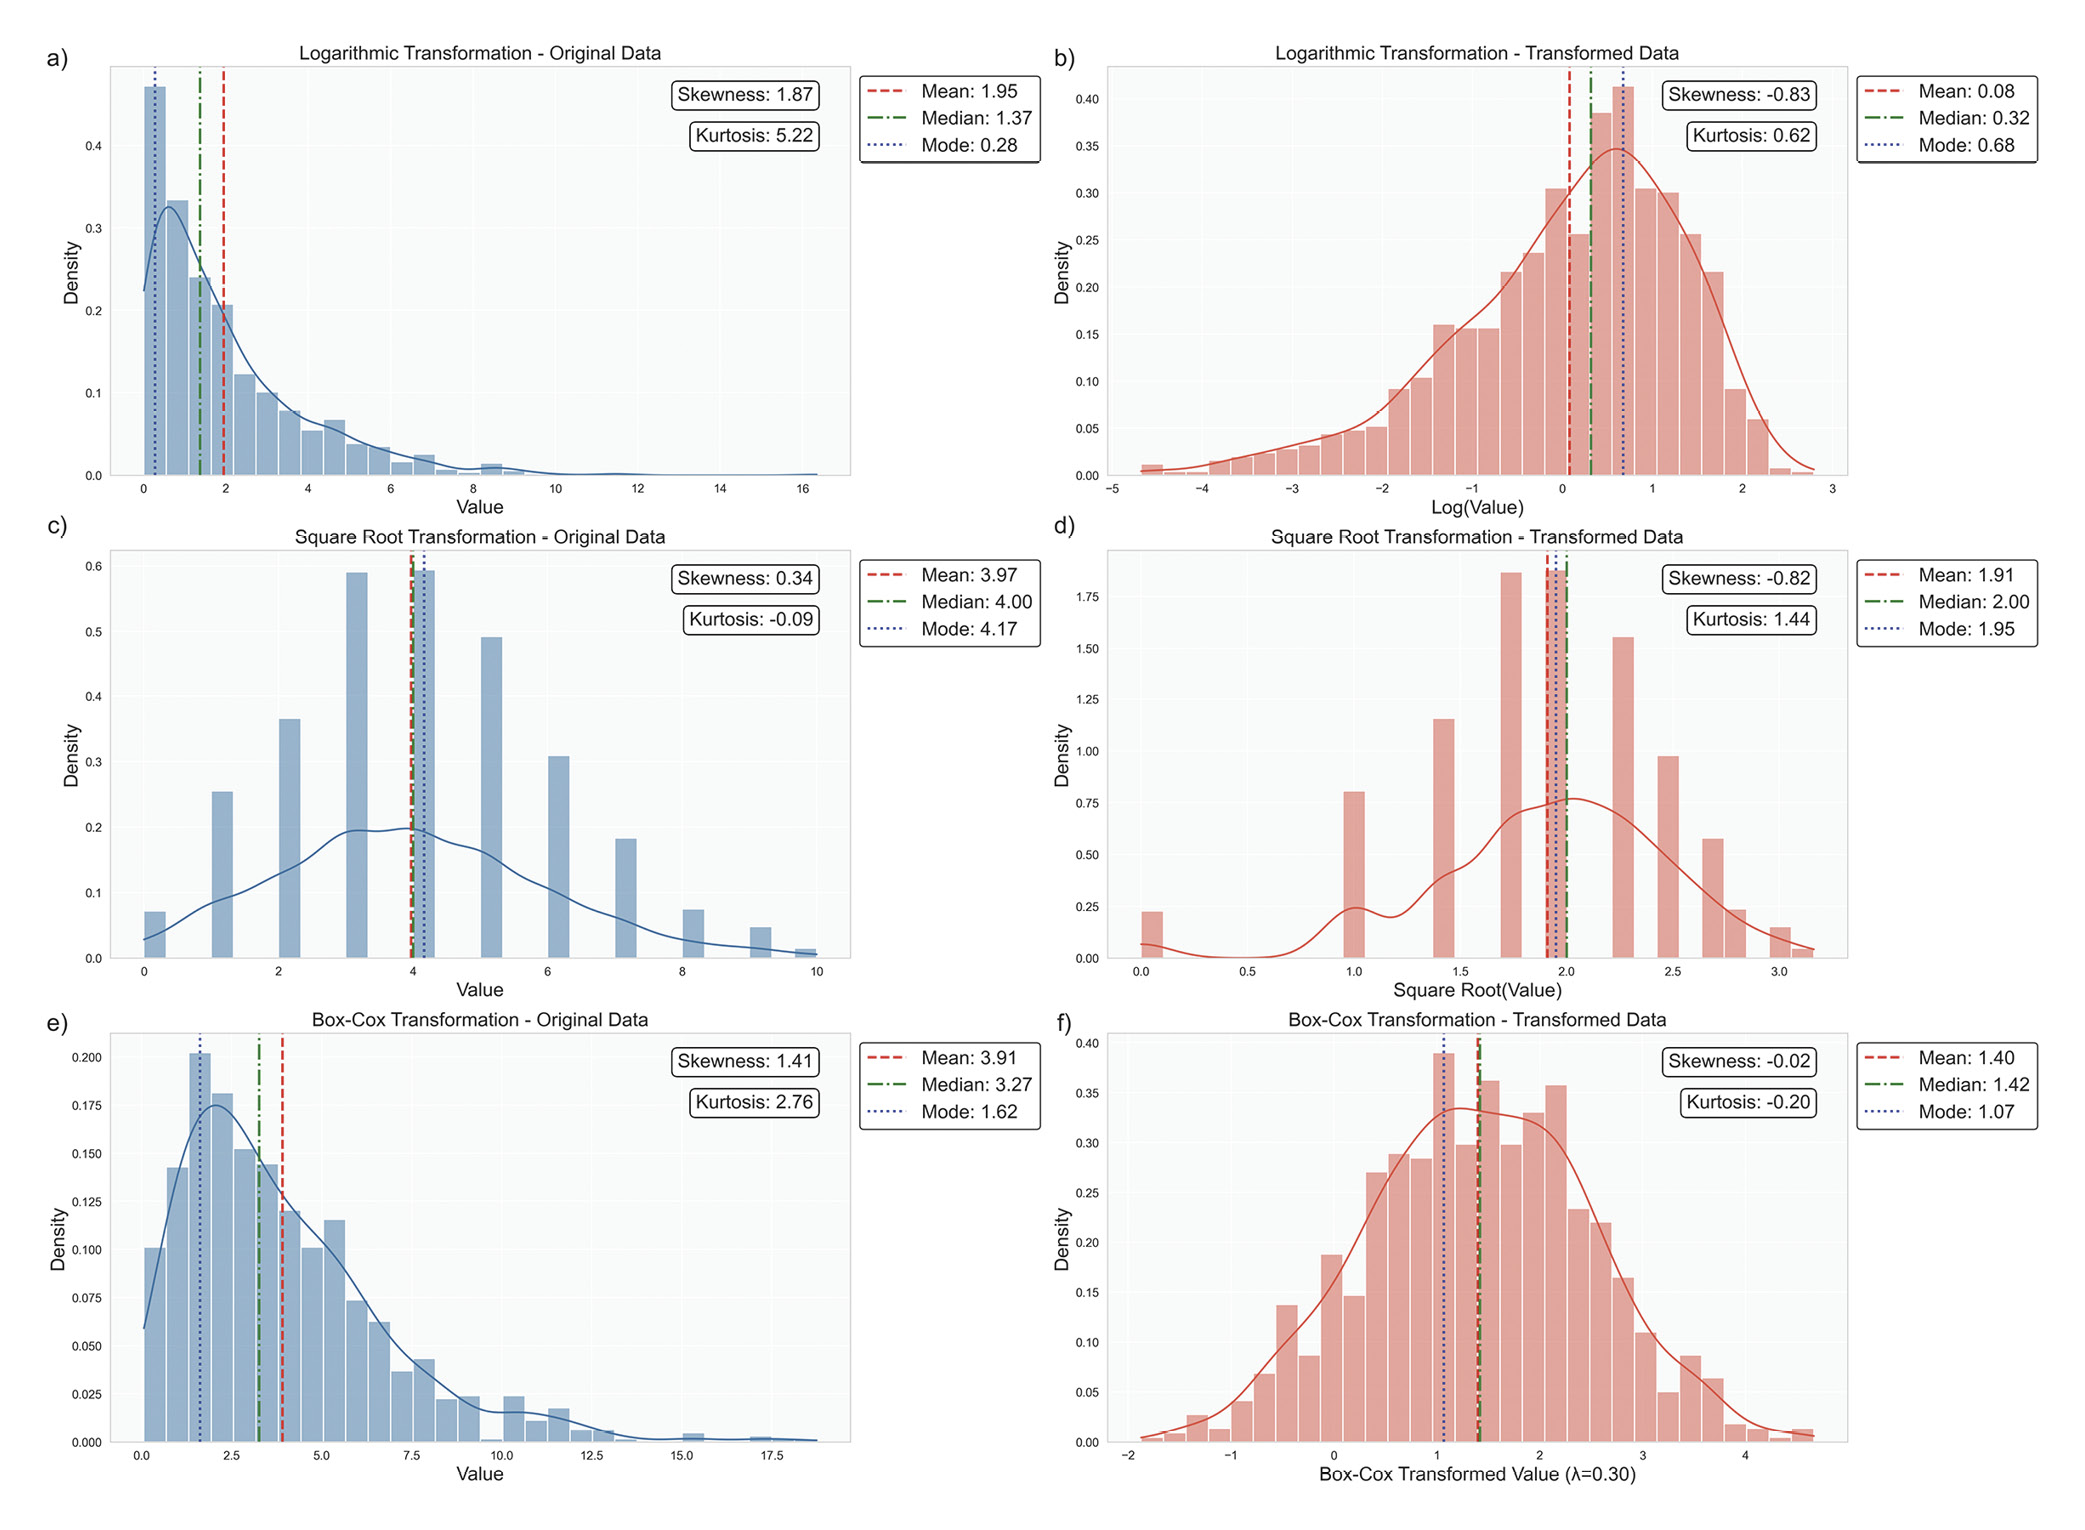
When data significantly deviate from normality, advanced techniques can help approximate normality and enhance the accuracy of statistical analyses. One commonly used strategy is data transformation. For instance, logarithmic transformations effectively address right-skewed data with positive values, such as reducing skewness in IOP measurements that contain high outliers, Figure 9a.58,72 Similarly, square root transformations help count data or variables following a Poisson distribution, such as the number of microaneurysms in diabetic retinopathy studies, Figure 9b.86,87 Another powerful technique is the Box-Cox transformation, which systematically identifies the optimal power transformation to achieve normality, providing a more formalised approach to data normalisation, Figure 9c.88
Some ophthalmic data may not follow a standard distribution at all. In cases of mixed distributions, specialised approaches are required. For instance, bimodal distributions, characterised by two distinct peaks, can occur in refractive error measurements, reflecting separate peaks for myopia and hyperopia.76,77 Similarly, multimodal distributions may appear in populations with subgroups, such as age-related variations in lens opacity, requiring techniques like finite mixture models to model the data accurately.89,90 When traditional transformations are insufficient to achieve normality or the data‘s structure inherently defies such transformations, non-parametric methods provide a robust alternative. This aligns with best statistical practices, which recommend tailoring the analytical approach to the data‘s characteristics rather than conforming the data to a preferred test.91 Non-parametric methods are invaluable in these scenarios, offering flexibility and reliability when parametric assumptions are violated. The subsequent articles in this series will delve deeper into the specific statistical tests suitable for these complex scenarios, ensuring a comprehensive understanding of both parametric and non-parametric methodologies.
Reporting Descriptive Statistics in Publications or Trial Reports
Descriptive statistics summarise the key features of a dataset, providing essential insights into patient demographics, clinical outcomes, and critical variables. By summarising data concisely, descriptive statistics help clinicians and researchers understand the general characteristics of their study population and highlight significant trends.
Reporting Standards for Different Types of Research: Adhering to established reporting standards ensures clarity, reproducibility, and transparency across various research disciplines. Different studies, such as randomised controlled trials, observational studies, qualitative research, and meta-analyses, require specific reporting guidelines (e. g., CONSORT for clinical trials,92 STROBE for observational studies,93 PRISMA for systematic reviews 94). Researchers should familiarise themselves with and follow the appropriate guidelines for their study design to enhance the quality and credibility of their reports. To effectively report descriptive statistics, researchers should:
• Ensure transparency in data handling, such as how missing data were addressed or outliers were managed.
• Clearly describe the data types (e. g., nominal, ordinal, continuous).
• Report measures of central tendency alongside variability.
• Specify sample sizes for each variable.
• Justify the choice of statistical measures (e. g., using median due to skewed distribution).
Best practices for reporting missing data involve distinguishing between missing completely at random (MCAR), missing at random (MAR), and missing not at random (MNAR). Researchers should employ appropriate statistical techniques (e. g., multiple imputations or maximum likelihood estimation) and report the extent and pattern of missing data, along with sensitivity analyses conducted to assess the results‘ robustness.
Outlier identification and management should be transparent and systematic. Standard methods include z-scores, modified z-scores (for non-normal data), and graphical techniques like boxplots. Researchers must evaluate outliers to determine their nature, whether they are data errors, valid physiological extremes, or measurement inaccuracies. Any decisions regarding the handling of outliers should be documented clearly to allow for critical evaluation and replication.
Data visualisation is essential for conveying distribution shape and variability, helping to identify issues such as skewness or outliers. Common methods include histograms, boxplots and Q-Q plots.
Transparency in reporting is crucial for reproducibility. Researchers should include graphical representations of data distributions and discuss normality assumptions and any corrective measures taken.
Descriptive statistics should be linked to clinical relevance, demonstrating their impact on clinical outcomes and decision-making. For instance, defining normative ranges for clinical measurements can assist in diagnosing conditions, while variability in treatment outcomes can inform clinical efficacy.
Conclusion
Rigorous and transparent reporting of descriptive statistics is essential for the integrity of clinical research. By following best practices – such as reporting central tendency and dispersion measures, properly managing outliers and missing data, and providing clear visualisations - researchers can enhance their findings‘ reliability and clinical relevance, ultimately improving patient care and outcomes in ophthalmic research.
Conflict of Interest Declaration
The authors declare that they have no affiliations with or involvement in any organisation or entity with any financial interest in the subject matter or materials discussed in this manuscript.
Funding Statement
This article did not receive a specific grant from public, commercial, or not-for-profit funding agencies.
Author Contributions
DO was the principal author and initiator of the article and was responsible for its conception, drafting, and writing. PMS reviewed the article and was responsible for reviewing and editing it for intellectual content, grammar, and coherence.
Appendix
COE Multiple Choice Questionnaire
The publication "Advancing Statistical Literacy in Eye Care: A Series for Enhanced Clinical Decision-Making" has been approved as a COE continuing education article by the German Quality Association for Optometric Services (GOL). The deadline to answer the questions is 01. January 2026. Only one answer per question is correct. Successful completion requires answering four of the six questions.
You can take the continuing education exam while logged in.
Users who are not yet logged in can register for ocl-online free of charge here.
Sajadi, M., Khabazkhoob M. (2023). Distribution and associated factors of intraocular pressure in the older population: Tehran Geriatric Eye Study. Int. J. Ophthalmol., 16, 418-426.
Lin, C. X., Guo, J. Y., Li, H., Fu, J., Wang, N. (2021). Distribution of IOP and its relationship with refractive error and other factors: the Anyang University Students Eye Study. Int. J. Ophthalmol., 14, 554-559.
Korean J Anesthesiol., 64, 402-406.
Am. J. Ophthalmol., 215, 66-71.
methods for outlier detection when benchmarking in clinical registries:
a systematic review. BMJ Open, 13, e069130.
Perera, S. A., Aung, T. (2017). Visual Field Progression in Patients with Primary Angle-Closure Glaucoma Using Pointwise Linear Regression Analysis. Ophthalmology, 124, 1065-1071.
Xiao, O., Yin, Q., Zheng, Y., He, M., Han, X. (2024). Axial Elongation Trajectories in Chinese Children and Adults With High Myopia. JAMA Ophthalmol., 142, 87-94.
Garcia-Zamora, M., Vega-Gonzalez, R., Ruiz-Moreno, J. M. (2022). Pathologic myopia and severe pathologic myopia: correlation with axial length. Graefes Arch. Clin. Exp. Ophthalmol., 260, 133-140.
Measurement: Measures of Central Tendency. Clinical Simulation in Nursing, 9, e617–e618.
(2005). Refractive error in urban and rural adult Chinese in Beijing. Ophthalmology, 112, 1676-1683.
123-134.
general population. Surv. Ophthalmol., 25, 123-129.
Corneal endothelial cell density and morphology in ophthalmologically healthy young individuals in Japan: An observational study of 16842 eyes. Sci. Rep., 11, 18224.
Macckey, D, A. (2021). Distribution and Classification of Peripapillary Retinal Nerve Fiber Layer Thickness in Healthy Young Adults. Transl.
Vis. Sci. Technol., 10, 3.
Birch, E. E. (2013). Normative reference ranges for the retinal nerve fiber layer, macula, and retinal layer thicknesses in children. Am. J. Ophthalmol., 155, 354-360 e1.
de Jong, P. T. (1997). Distribution of central corneal thickness and its association with intraocular pressure: The Rotterdam Study. Am. J. Ophthalmol., 123, 767-772.
(2006). Changes in glaucoma treatment and achieved IOP after introduction of new glaucoma medication. Graefes Arch. Clin. Exp. Ophthalmol., 244, 1267-1272.
The xtrccipw command. Stata. J., 17, 253-278.
