The effects of luminance, contrast and glare on visual acuity
Purpose: Clinical visual acuity (VA) is typically measured under optimal conditions. However, such settings may not represent more naturalistic environments where observers are frequently faced with low contrast targets viewed under low luminance and accompanied by glare. The aim of this study was to measure VA under both optimal and suboptimal conditions in younger and older adults.
Material and Methods: The study was performed on 30 older (aged 50-71 years) and 30 younger (21-28 years) subjects. High (0.0 log unit) and low (1.05 log unit) contrast VA was tested, both with and without a 0.3 log neutral density filter to alter luminance levels, as well as with and without an LED glare source being directed into the eye.
Results: Reducing contrast and glare produced a significant decline in VA, although the effect of the glare source used here did not have a significant effect. Both age groups showed similar rates of decline in VA. The best and worst VA was observed under the high contrast at high luminance without glare and low contrast at low luminance with glare conditions, with mean (SD) values of 0.01 (0.02) and 0.59 (0.03) logMAR, respectively (p < 0.001). Of the parameters tested, decreasing contrast produced the largest decrement in VA.
Conclusion: These findings have considerable clinical significance. For example, when trying to see at nighttime, a subject with excellent VA in the examination room might exhibit very poor visual resolution under degraded conditions. Clinical measurements should include assessment of visual performance under sub-optimal conditions.
Introduction
Measurement of visual acuity (VA) is probably the most commonly performed procedure in vision examinations and screenings. Assessment of VA is carried out routinely to assess visual function in patients of all ages, where ambient illumination and contrast are typically presented at optimal levels. However, it is questionable whether such testing is representative of reallife visual demands.
Under naturalistic viewing conditions, one is likely to experience a wide range of illumination, contrast and glare conditions, which may have significant detrimental effects on the quality of vision, particularly in older adults. Accordingly, clinical testing under optimal conditions may not provide an accurate assessment of the patient’s ability to function in their habitual environment. It is known that VA declines with reduced contrast, and at a greater rate when the contrast level falls below 35 %.1 Additionally, chart luminance is significant, and Giang et al.2 noted an average improvement in VA of −0.12 and −0.07 logMAR in uncorrected and corrected subjects, respectively, when the luminance of the acuity chart was increased from 26 cd/m2 to 153 cd/m2. The surrounding luminance also impacts VA; average improvements of 0.12 and −0.07 logMAR were observed in uncorrected and corrected participants, respectively, when the surrounding luminance was increased from 4 cd/m2 to 102 cd/m2.2 Indeed, reduced luminance and contrast, as well as increased blur show additive negative effects on VA.3 Johnson and Casson noted that an individual having VA of 6/6 under high luminance and high contrast conditions may exhibit VA of only 6/30 under low luminance and low contrast conditions.3 However, this study was performed on only four, non-naïve subjects.
An additional factor, not considered by Johnson and Casson,3 is the effect of disability glare. This may also have a negative effect on VA due to the scattering of light at the retina and the resulting decrease in the contrast of the retinal image.4,5,6,7,8,9,10 Kimlin et al.11 found that intermittent glare had a significant negative impact on driving performance at night, particularly with regard to pedestrian recognition.
Many of the detrimental effects produced by suboptimal viewing conditions will be exacerbated further in older individuals. For example, age related miosis and media opacities will reduce retinal illumination.12,13,14 Additionally, contrast sensitivity (CS) decreases with age 4,15 at a rate of 0.45 log CS/decade of life between 50 and 80 years of age.14 Bailey and Bullimore 16 determined the effect of age on the glare disability index (GDI), i.e., the difference in low contrast VA between no glare and high glare conditions. These authors found GDI values in younger (15-41 years) and older (50-82 years) subjects of 2.3 and 10.2, respectively, indicating greater disability in older adults. Other ocular changes with age that may affect visual performance are the size of the haloes produced by glare sources 7 and an increase in mesopic glare sensitivity.4 In addition, there is evidence that periodic peripheral glare results in a reduction in pupillary diameter and consequently reduced retinal illumination. These changes were more profound in older adults.12
Measurements of visual function which consider the impact of different contrast, luminance and glare levels may provide a more comprehensive assessment of visual performance in everyday life. For example, Kimlin et al.11 found that while photopic high and low contrast VA, mesopic high contrast VA and mesopic contrast sensitivity all showed a significant association with nighttime driving performance, mesopic high contrast VA exhibited the highest correlation amongst these factors. Even under photopic conditions, low contrast VA showed a greater correlation with driving scores than high contrast VA,11 while Wood and Owens noted that contrast sensitivity provides a better prediction of recognition performance under real world conditions than visual acuity.17 Furthermore, Jones et al.14 observed a significant correlation between nighttime driving performance (hazard detection distance) and both contrast sensitivity and low contrast VA in healthy older subjects, whereas high contrast VA showed no significant correlation.
In routine eye examinations, inquiries regarding the perspective of patients as to their ability to function under various luminance, contrast and glare levels are not undertaken routinely. However, there is evidence that patients are affected to a greater extent by these varying visual conditions than might be presumed. Stafford Sewall et al.18 assessed night-time driving in older and younger adults while manipulating the headlight beam intensity of both the participant’s and opposing cars; results showed that in general, older adults overestimated the distance at which they could detect hazards by 69 %, whereas younger adults were more accurate.
Accordingly, the aim of the present study was to assess the effect of varying luminance, contrast and glare levels on VA in both older and younger adults. A practical and accessible method of assessment was implemented which may be trans-ferrable to the clinical setting. We hypothesized that lower luminance, contrast and the presence of glare will result in significantly reduced VA, particularly in older subjects.
Methods
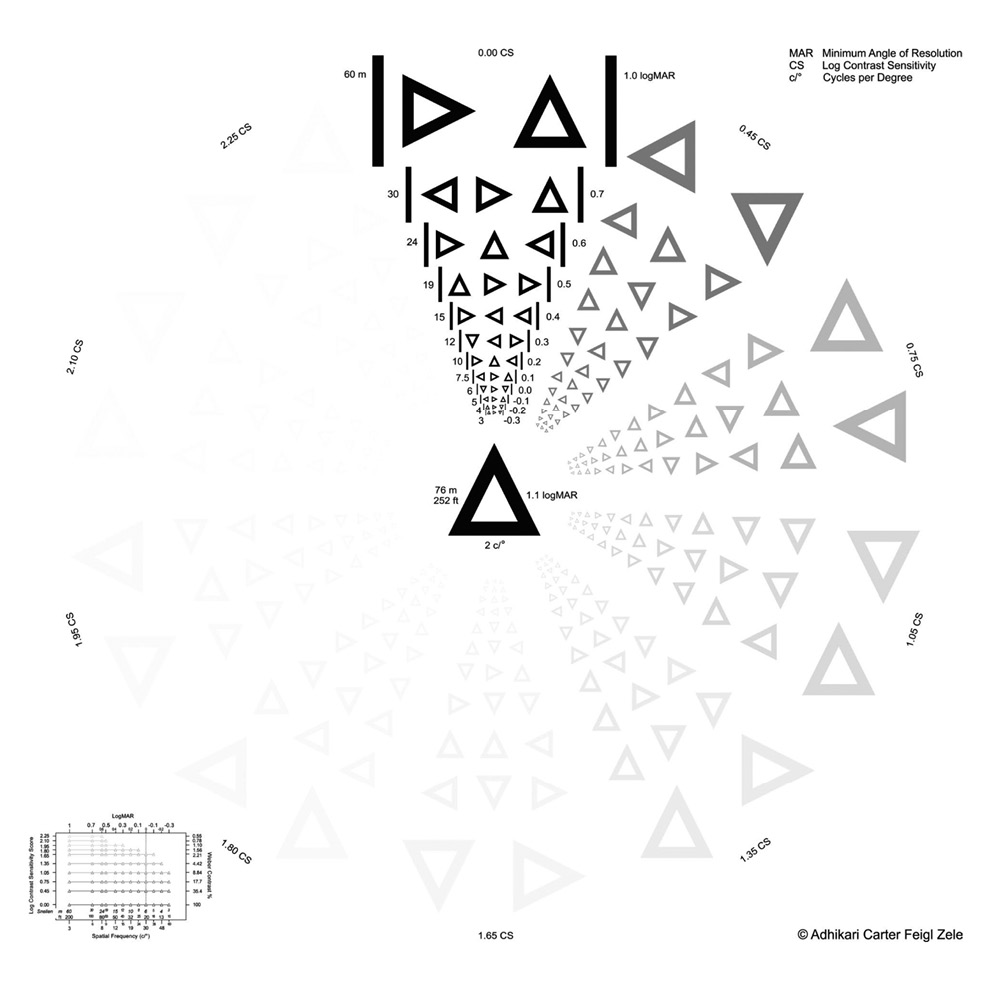
This study included 60 participants recruited at the State University of New York (SUNY) College of Optometry. The younger age group comprised 30 participants between 21-28 years of age (mean age 24.1 years; SEM = 0.34 years; 3 male, 27 female), all of whom were optometry students at the college. The older group consisted of 30 subjects between 50 and 71 years of age (mean age = 60.8 years; SEM = 1.18 years; 14 male, 15 female, 1 chose not to answer); they comprised members of the SUNY community including faculty, staff and friends or family members referred by the participants or students at the college. There were no exclusion criteria other than an inability to resolve the largest target (1.00 logMAR at 3 m), on the Adhikari Carter Feigl Zele logMAR chart,19 shown in Figure 1. This chart includes symbol frequencies between 0.38 and 60 cycles per degree, over a range of 0.55 % – 100 % contrast. All participants provided informed written consent after a full explanation of the procedures prior to the study, the protocol was approved by the Institutional Review Board at the SUNY College of Optometry (number 2210697) and was conducted in accordance with the Declaration of Helsinki. Data were collected over a single 20-minute session per subject.
A within-subject design was used whereby subjects were tested under eight different conditions. These were (i) high contrast (HC) at high luminance (HL), (ii) HC at low luminance (LL), (iii) low contrast (LC) at HL and (iv) LC at LL. All condi-tions were then repeated with an external glare (GL) source. The order of testing was counterbalanced across subjects using a Latin square design.
Participants wore their habitual distance correction (spec-tacles or contact lenses) throughout the study. The left eye was arbitrarily selected as the testing eye for all subjects, and the right eye was fully occluded. VA was measured at 3 m (the calibration distance of the chart) using the Adhikari Carter Feigl Zele logMAR chart 19 – see Figure 1.
A low luminance condition was created by subjects hold-ing a 0.3 log neutral density filter (50 % transmittance; Lee Filters, USA) over the eye being tested and positioned as close to the eye as possible. The luminance of the acuity chart (without the neutral density filter) at 3 m was 24 cd/m2. In addition, two target contrast levels were tested, namely HC (0.0 log unit, 100 %) or LC (1.05 log unit, 11 %). An angled table lamp containing a white LED light source, equivalent to a 60-watt incandescent bulb, was placed 30 cm in front of the subject at an angle of 36° from the midline and directed into the participant’s left eye to create GL. The illumination from the GL source was 26 lux.
Participants were directed to view the Adhikari Carter Feigl Zele logMAR chart at 3 m, and to state the direction (up, down, left or right) of each triangle apex aloud. VA was determined as the smallest line on which subjects identified correctly the orientation of at least two of the three triangles. Subjects were given one attempt at each level of acuity, except for a few participants who lost their place or had difficulties with directions who were allowed an additional attempt. VA was measured in this manner under the eight different testing conditions described above.
Statistical Analysis
The visual acuity measurements for the different conditions (contrast, luminance and glare) in the two age groups were compared using three-way mixed analysis of variance (ANO-VA) and post-hoc Bonferroni correction, adjusting alpha to 0.0018 (0.05/28), based on the number of comparisons (28). In addition, partial eta square ( 2p) was used to determine the size effect. Analyses were performed using IBM SPSS 27 statistical software (IBM, USA).
Results
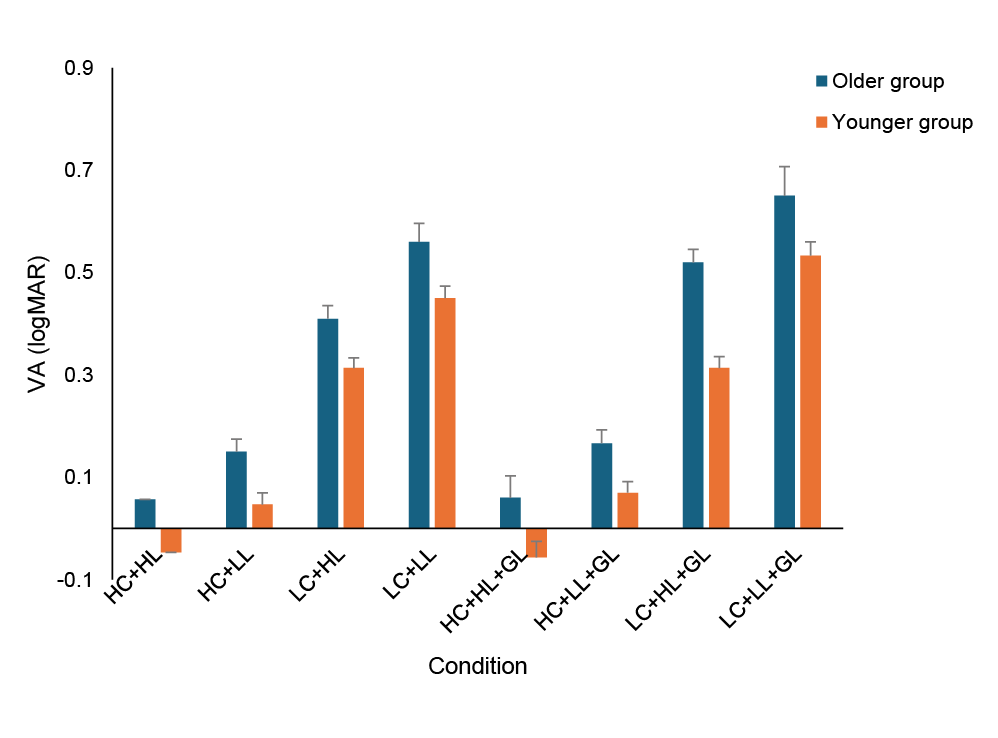
Mean values of visual acuity for the older and younger adults for the various viewing conditions are shown in Figure 2. It is apparent that reducing contrast and luminance produced a marked decline in visual acuity.
A three-way mixed ANOVA was used to assess the main effects of the three conditions (contrast, luminance and glare) as well as the interaction with age. The assumption of sphericity was assessed using the Mauchly test, which was significant (p < 0.001), indicating that this assumption was not met. Accordingly, the Greenhouse-Geisser correction was applied (ε = 0.48). The repeated measures analysis indicated a significant effect of the measurement conditions with a large size effect (F(3.4, 196.5) = 228.3, p < 0.001, 2p = 0.797, β−1 > 0.99). However, the interaction between the age group and condition was not significant (F(3.4, 196.5) = 1.38, p = 0.25, n2p = 0.023, β−1 = 0.07), i. e., the pattern of responses was similar across the two groups.
Although no significant interaction was found between the test conditions and age, the between-subjects effect showed substantial differences between the two age groups F(1,58) = 10.7, p = 0.002). Nevertheless, the partial eta square was low ( 2p = 0.16), i. e., explaining 16 % of the variance after controlling for other effects. In addition, the observed power was also low (β−1 = 0.505), indicating a 50 % probability of detecting a genuine difference of this size with the sample used. This suggests that the analysis was inadequately powered.
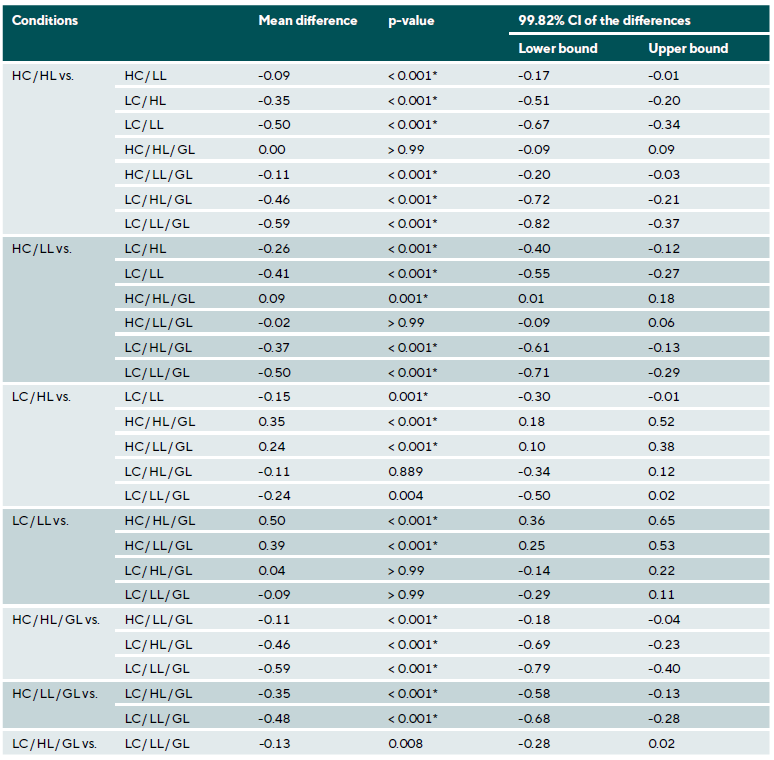
Accordingly, a one-way repeated measures ANOVA was conducted for each age group. For the older group, the assumption of sphericity was assessed using the Mauchly test, which was significant (p < 0.001), indicating that the assumption was not met. Thus, the Greenhouse-Geisser correction was applied (ε = 0.38). ANOVA showed significant differences between the test conditions with a large size effect (F(2.6, 76.1) = 83.1, p < 0.001, 2p = 0.741, β−1 > 0.99). Post-hoc analy-sis with Bonferroni correction and alpha adjusted to 0.0018 (Table 1) showed the differences were significant for the vast majority of the conditions tested.
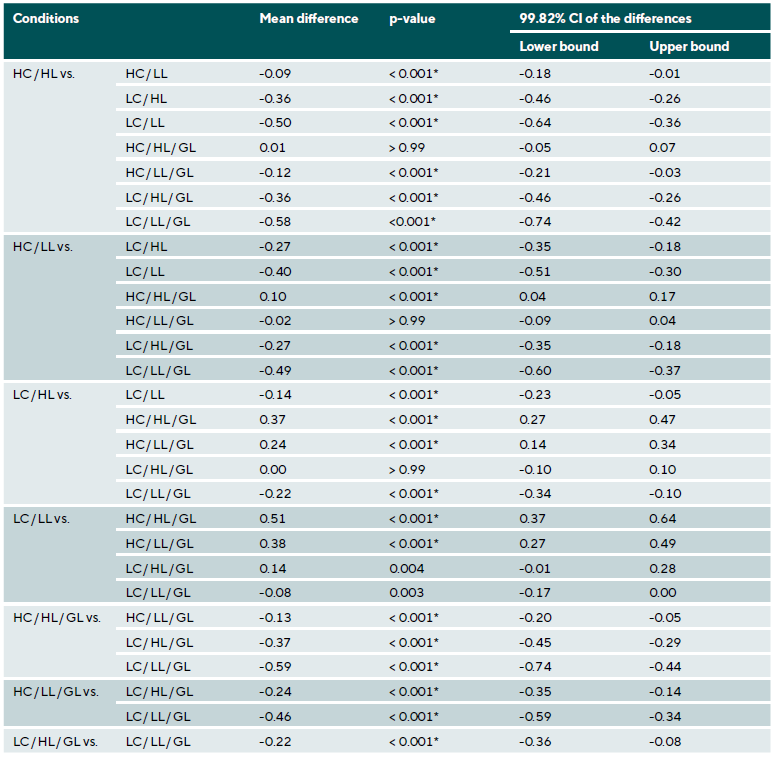
For the younger group, the assumption of sphericity was assessed using the Mauchly test, which was significant (p < 0.001), indicating that the assumption was not met. Thus, the Greenhouse-Geisser correction was applied (ε = 0.43). ANOVA showed significant differences between the VA con-ditions with a large size effect ((F(3, 86.7) = 198.3, p < 0.001, 2p = 0.741, β−1 > 0.99). Post-hoc analysis with Bonferroni correction and alpha adjusted to 0.0018 (Table 2) showed the differences were significant for the vast majority of conditions.
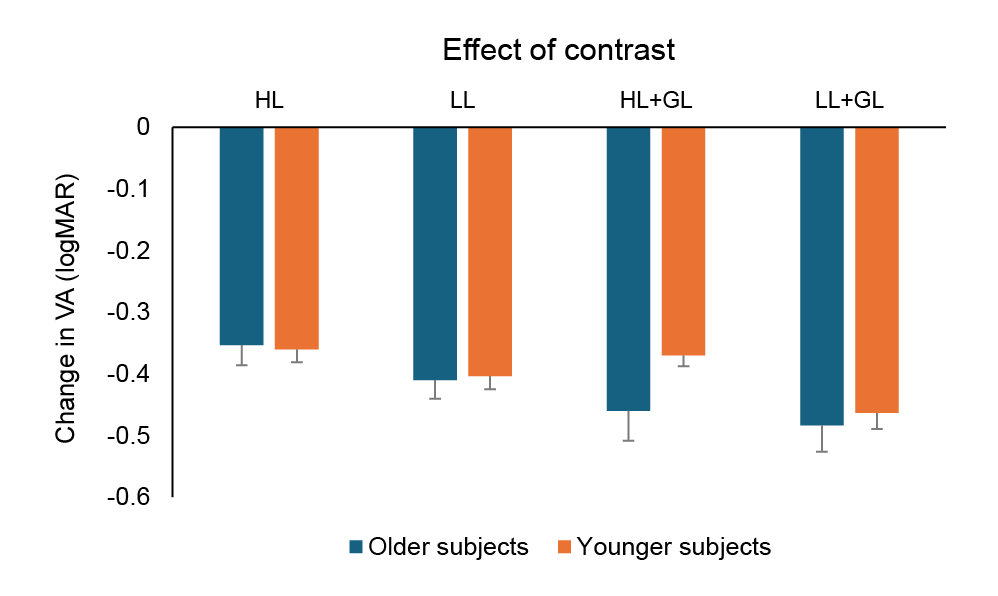
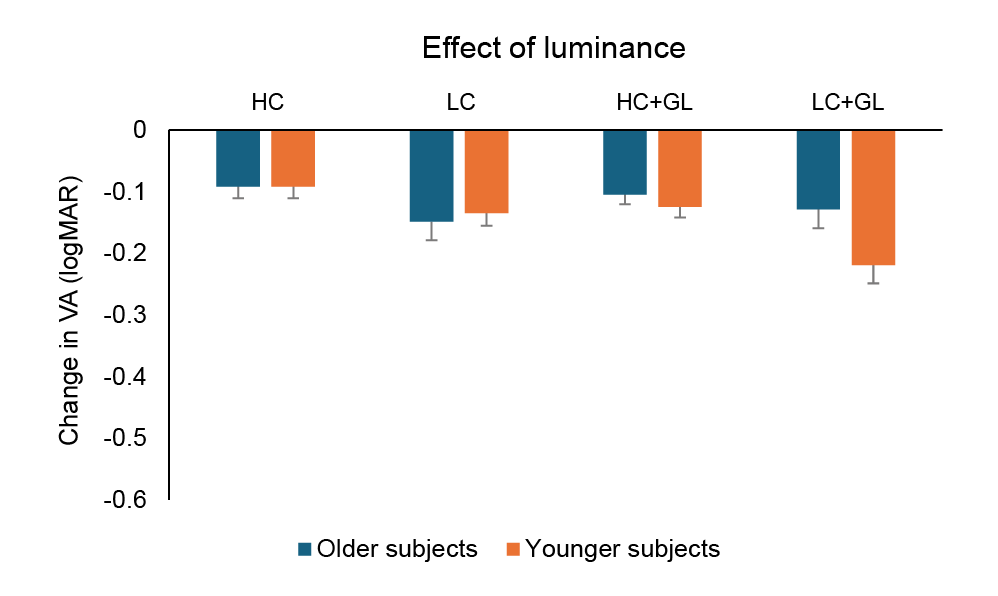
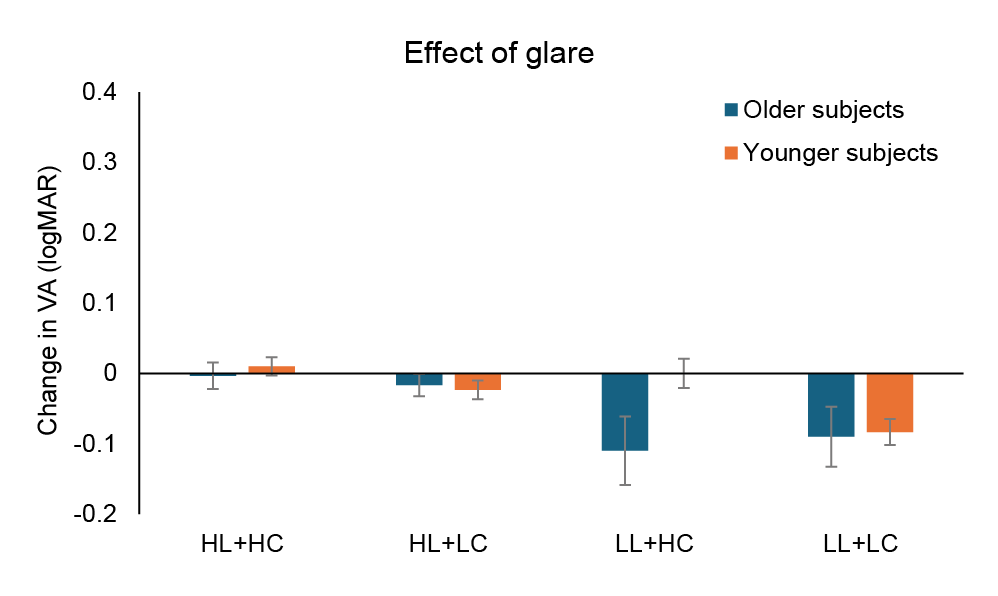
The effects of each variable are shown graphically in Figures 3-5 which illustrate the impact of changes in contrast, luminance and glare, respectively. In each case, the change in VA was determined by subtracting the suboptimal finding from the optimal finding. Thus, the effect of contrast was quantified as the HC finding minus the LC finding for the various conditions.
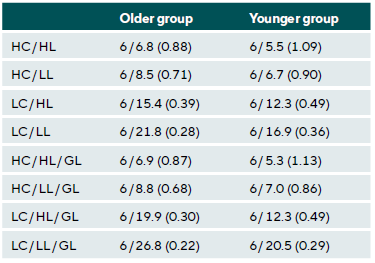
Finally, the mean values of VA, converted to a Snellen fraction, for the two age groups in the various test conditions are shown in Table 3.
Discussion
The aim of this investigation was to understand the effects of reduced contrast and luminance, as well as increased glare on VA in both younger and older adults. The results show that both low luminance and contrast resulted in a significant decline in VA. These findings are consistent with previous studies.1,2,20,21,22 However, examination of Figures 3 and 4 indicate clearly that the effect of reduced contrast (from 100 % to 11 %) on VA was far greater than the effect of reduced luminance (from 24 cd/m2 to 12 cd/m2) under the conditions tested here. Contrast reduction produced a decline in VA by around 0.30-0.40 logMAR, whereas reduced luminance only produced a reduction in VA of around 0.10 logMAR. This may be related to the specific parameter values adopted in this study, and different degrees of change would probably alter VA by varying amounts.
Additionally, interaction effects were noted between low contrast and low luminance. Previous studies have shown that contrast sensitivity declines with decreasing luminance, with greater impairment at higher spatial frequencies.5,23 Indeed, Johnson and Casson 3 observed that changing from a 97 % contrast target at 75 lux to an 8 % contrast optotype at 7.5 lux produced a reduction in mean VA from approximately 6/5.4 to around 6/18, which is very similar to the results shown in Table 2 for the younger subject group (6/5.5 to 6/16.9 when changing from HC/HL to LC/LL). Indeed, low contrast VA and glare sensitivity were found to predict subjective measures of visual disability independently based on the Activities of Daily Vision Scale.24
Interestingly, the effect of glare, as shown in Figure 5, was minimal under high luminance conditions for both age groups, and only produced a decline around 0.10 logMAR (one line of letters) for the older subjects under low luminance conditions. This may have been because the magnitude of glare adopted here (26 lux at an angle of 35° from the midline) was insufficient to produce large changes in VA. For comparison, the manufacturer of the Oculus Mesotest II (Oculus Inc, USA) reports a glare luminance of 0.1 cd/m2 Indeed, Maniglia et al.8 noted that a 69 lux glare source was not sufficiently strong to produce significant changes in contrast sensitivity under both photopic and mesopic conditions in young participants. However, a 225 lux glare source did reduce contrast sensitivity, particularly at low spatial frequencies (3 cpd). It has previously been noted that the impact of glare will vary with the luminance, angular size, eccentricity, spectral content and arrangement of the glare source (or sources), although the exact mechanisms underlying each factor are somewhat unclear.25 Accordingly, further studies are needed to examine the effect of stronger glare sources at varying eccentricities, particularly in older participants. In addition, it might be anticipated that the effect of added glare would be greater in subjects with media opacities. Amongst the older group of subjects tested here, three self-reported having cataracts. For these individuals, the addition of glare produced a decline in VA of 0.07, 0.07, 0.33 and 0.20 logMAR for the HC/HL, HC/LL, LC/HL and LC/LL conditions, respectively. It should also be pointed out that while we did not specifically ask the subjects if they had undergone cataract removal, to our knowledge, none of them had experienced such surgery. Indeed, an original aim of this investigation was to examine the effects of various abnormal ocular conditions on visual resolution under degraded stimulus conditions (this was the reason why very few inclusion and exclusion criteria were adopted). However, the number of participants recruited with specific ocular abnormalities was too small to draw any definitive conclusions. Future studies should examine the impact of conditions such as macular degeneration, corneal opacities and dry eye disease, as well as cataracts.
Further, pupil dynamics may also affect visual resolution. Pupillary constriction may reduce VA due to reduced retinal illumination and increased diffraction, although it will also reduce the magnitude of ocular aberrations. Wiggins et al.26 noted that not only did pupillary dilation reduce VA in cataract patients when tested under standard conditions, but also when implementing the brightness acuity test (BAT; Marco, USA), where VA was reduced in 53.7 % of subjects by one or more lines of following pupil dilation. They also noted that the VA reduction with the BAT following dilation depended on the type of cataract, with a greater impact being observed when nuclear, cortical and posterior subcapsular or nuclear and posterior subcapsular cataracts were present simultaneously.26
In addition, increased glare sensitivity may vary with the degree of ocular pigmentation in older adults, since greater levels of iris and retinal pigment may increase light scatter.27 However, the pigmentary characteristics of the subjects in the present study were not recorded. Interestingly, the ef-fect of contrast, luminance and glare were similar between the two age groups. Considering the data shown in Figure 2, the change in mean logMAR VA between the HC/HL and LC/LL for the older and younger subjects, without and with glare were 0.18, 0.18, 0.18 and 0.21, respectively. In other words, the decline in VA induced by the experimental changes was equivalent in the older and younger subjects.
However, the younger age group showed between 0.10 and 0.12 logMAR better VA across all conditions (all p < 0.03).
Prior studies have shown an age-related decline in CS and VA as a function of low luminance.1,5,23 Jones et al.14 reported that contrast sensitivity decreased by approximately 0.45 log CS/decade. Owens and Tyrrell 13 showed in a driving stimulation study that steering performance declined with decreasing levels of luminance in healthy young, middle-aged and older adults; however, older adults experienced the greatest impact. Further, an age-related reduction in contrast sensitivity and an increase in glare-related VA loss have been demonstrated previously.4,24,27 The absence of age effects in the present study may be due to a number of factors. In the current study, approximately 50 % of the individuals in the older age group were under 60 years of age, and only three reported the presence of cataracts. Chua et al.28 noted age effects on visual acuity and contrast sensitivity in subjects with cataracts only at or above 60 years of age; they did not find any age effects on glare disability. Therefore, this relatively young and healthy older age group tested in the present investigation may not have yet developed any visual decline.
This study did have significant limitations. As noted above, some 50 % of the older population was under 60 years of age, which is when an age related decline in contrast sensitivity typically becomes pronounced.29 This may have contributed to a lack of observed age effects. To examine this effect further, the older group was subdivided into two equal sized age groups, namely ≤ 61 years of age and > 61 years of age (N = 15 in each subgroup). A repeated measures ANOVA and post-hoc t-tests indicated that the only significant difference occurred for the low contrast, low luminance and glare condition, with mean values (±SD) of 0.50 (0.08) and 0.80 (0.35) logMAR being recorded for the ≤ 61 and > 61 years of age subgroups, respectively (p = 0.006). While the effect size was large (Co-hen d = −1.17), the confidence interval was extremely wide (99.4 % CI [−1.11 - 0.11], indicating low reliability of the effect.
Future studies consisting of a greater age range (particularly subjects over 60 years of age) should be carried out. Further, the number of subjects with specific ocular diseases was insufficient to reach any conclusions in this regard. A larger sample together with a comprehensive ocular health examination would be useful to guide the inclusion of subjects and allow further testing. The sample size of older adults who self-reported having cataracts here was very small (N = 3). Further investigation of participants with cataract, together with an evaluation of the type of opacity would be valuable. Additionally, the sex distribution of the two age groups was very different, with 48 % and 10 % of the older and younger groups, respectively, being male. While there is no evidence for differences in the effect of changing luminance and contrast with sex, it would have been better if the two age groups had similar sex distributions. Finally, the luminance of the glare source was insufficient to produce significant changes, and higher luminance levels should be used in future investigations.
The findings of the current study support the need to include low luminance and particularly low contrast testing during routine eye examinations. A subject who presents with excellent VA when tested under standard clinical conditions (HC/HL), will likely exhibit markedly reduced visual resolu-tion when viewing low contrast targets at low luminance in the presence of glare. The latter is more representative of demanding, real-world conditions, such as driving at night. Interestingly, many jurisdictions use a VA standard of 6/12 to determine whether an individual should be issued with a driving license. Even in young, healthy subjects, the findings listed in Table 3 indicate that under suboptimal conditions (but perhaps equivalent to those encountered at night in poor weather), the VA fell markedly below this minimum standard. Therefore, assessment of VA under optimal conditions in the clinical examination room does not reflect how a person sees under such degraded situations. Accordingly, we recommend that all patients, irrespective of age, be tested under varying luminance, contrast and glare conditions as part of the clinical examination, in addition to conventional high contrast testing without glare under high luminance through the optimal refractive correction. This will allow a more complete assess-ment of the patient’s ability to perform under naturalistic viewing conditions.
Conflict of Interests
The author declare that there is no conflict of interests re-garding the methods and devices mentioned in the article.
COE Multiple Choice Questionnaire
The publication "The effects of luminance, contrast and glare on visual acuity" has been approved as a COE continuing education article by the German Quality Association for Optometric Services (GOL). The deadline to answer the questions is 1 December 2026. Only one answer per question is correct. Successful completion requires answering four of the six questions.
You can take the continuing education exam while logged in.
Users who are not yet logged in can register for ocl-online free of charge here.
effect of central and peripheral luminance on visual acuity. Indian J.
Ophthalmol., 72(Suppl 5), S875-S881.
blur on visual acuity. Optom. Vis. Sci., 72, 864-869.
50+ elderly: experimental study. Int. J. Occup. Med. Environ. Health, 27,
444-459.
glare: light scatter and retinal luminance as predictors of sensitivity to
contrast. J. Opt. Soc. Am. A, 32, 576-585.
glare vision in young adult subjects. Sci. Rep., 13, 3508.
C. (2013). Normal values for the size of a halo produced by a glare source.
J. Refract. Surg., 29, 618-622.
varying levels of glare on contrast sensitivity measurements of young
healthy individuals under photopic and mesopic vision. Front. Psychol.,
9, 899.
measurement: an ophthalmological perspective. Acta Ophthalmol.
Scand., 85, 354-360,
remediation. RE:View 29,101-13.
adults: effects of glare and association with mesopic visual function.
Invest. Ophthalmol. Vis. Sci., 58, 2796-2803.
Pupil dynamics with periodic flashes: effect of age on mesopic adaptation.
J. Opt. Soc. Am. A., 33, 1546-1552.
nighttime visual guidance: a test of the selective degradation hypothesis.
J. Exp. Psychol. Appl., 5, 115-128.
(2022). Contrast sensitivity and night driving in older people: quantifying
the relationship between visual acuity, contrast sensitivity, and hazard
detection distance in a night-time driving simulator. Front. Hum. Neurosci.,
16, 914459.
contrast sensitivity in visual pathways: A pilot study on flicker adaptation.
PLoS One, 16, e0261927.
glare. Optom. Vis. Sci., 68, 911-917.
not predict drivers’ recognition performance under day or night conditions.
Optom. Vis. Sci., 82, 698-705.
The accuracy of drivers‘ judgments of the effects of headlight glare on
their own visual acuity. Perception, 43, 1203-1213.
of a chart-based measure of the limits of spatial contrast sensitivity.
Ophthalmic Physiol. Opt., 42, 110-122.
Effects of miosis on the visual acuity space under varying conditions of
contrast and ambient luminance in presbyopia. J. Clin. Med., 13, 1209.
Wilhelm, H., Coeckelbergh, T., Emesz, M., Marvan, P., Nischler, C. (2009).
Association of lens opacities, intraocular straylight, contrast sensitivity
and visual acuity in European drivers. Acta Ophthalmol., 87, 666-671.
challenges on steering performance in visually healthy young drivers.
Optom. Vis. Sci., 82, 689-697.
spatial contrast sensitivity at low luminance. Vision Res., 28, 1235-1246.
Fried, L. P., West SK. (2001). The association of multiple visual impairments
with self-reported visual disability: SEE project. Invest. Ophthalmol.
Vis. Sci., 42, 64-72.
central vision. Invest. Ophthalmol. Vis. Sci., 56, 464-471.
Glare testing in patients with cataract after dilation. Ophthalmology,
116, 1332-1335.
Fried, L. P. (1997). A comprehensive assessment of visual impairment in a
population of older Americans. The SEE Study. Salisbury Eye Evaluation
Project. Invest. Ophthalmol. Vis. Sci., 38, 557-568.
and location on visual function: the Blue Mountains Eye Study. Eye
(Lond.), 18, 765-772.
human contrast sensitivity. Acta Ophthalmologica, 7, 679-690.