Evaluating treatment effectiveness in a case series of myopia patients
Purpose: This patient case series describes the response to myopia control contact lens treatments and compares the use of five methods evaluating the efficacy of the treatments.
Methods: Data from the myopia management clinic, Glasgow Caledonian University included age, axial length (AL) spherical equivalent refraction (SER) and treatment (orthokeratology (OK), dual focus (DF) and multifocal (MF) contact lenses (n=5 for each treatment)). Treatment effectiveness was evaluated by five methods (1-4 used AL and 5 used SER): 1.Percentile Method using AL growth curve data, 2.Mean Efficacy Method using AL mean values from literature, 3. Cumulative Absolute Reduction in axial Elongation (CARE) method and 4.Emmetropic Growth Method using emmetropic AL growth as a target. 5.Decrease in rate of SER progression.
Results: The Percentile Method indicated that treatment was effective in 53% of patients: three OK, two MF and four DF patients. The Mean Efficacy and CARE methods indicated treatment effectiveness in 33% and 27% of patients respectively: two OK, one MF and one DF patients. None of the patients met the target for the Emmetropic Growth Method. SER method indicated treatment effectiveness for 20% of patients: one DF and MF patient.
Conclusions: In this case series, emmetropic growth as a target was unobtainable due to modest treatment effects. Using SER alone was not sufficient to detect small treatment effects. Growth curve data were limited when evaluating those with a longer AL and short term treatment effects. The Mean Efficacy and CARE Methods are more suitable method for short term clinical decision making in this case series.
Introduction
The prevalence of myopia is increasing globally and it is estimated by the year 2050 that almost half of the world’s population will have myopia1. In response to this global health concern, the range of available myopia management options has diversified and now includes various contact lens options including dual focus2 (DF), multifocal3,4 (MF) and orthokeratology3 (OK) as well as novel spectacle lens options5. Pharmacological treatments including atropine are available in various parts of the world but are not yet licensed for myopia management in countries such as the UK. Although studies indicate that myopia management contact lenses are widely successful in reducing myopia progression, there is a wide range of success reported. The effectivity in slowing axial elongation using MF contact lenses is between 25% and 79%3, using OK contact lenses between 30 and 65%3 and using DF (MiSight) contact lenses of between 36%6 and 52%3. Therefore, once a treatment has been decided upon and implemented by a practitioner, the next challenge is to evaluate whether treatment is successful for that individual patient. The international myopia treatment guidelines7 suggest that axial length (AL) should ideally be the primary parameter monitored in children rather than spherical equivalent refraction (SER), and this is supported by a recent in-depth review8. The measurement of AL is much less variable (0.026mm9=0.07D) than the measurement of SER using non cycloplegic subjective refraction which requires a change in refractive error of more than +0.50D to be considered signifcant10. There are various ways in which AL could be used to evaluate treatment efficacy. Recently, AL growth curves have been applied to patients undergoing treatment using atropine11 and DF contact lenses12. Such growth curves account for changes to the rate of axial elongation with age across various percentiles within a population dataset. Other methods of evaluating treatment efficacy may utilise AL targets such as the expected mean efficacy values published in literature3 or the rate of axial elongation per year in an emmetrope of the same age13. Cumulative Absolute Reduction in axial Elongation (CARE) has been proposed to be the preferred method of conveying treatment efficacy as it is independent of age, rate of progression and ethnicity8. Currently, there are no published data which have compared various methods of evaluating treatment efficacy and applied these methods to a case series. This information is of utmost importance if there is an increasing expectation that community practitioners should be managing patients with progressive myopia and will provide useful insight for those practitioners contemplating the implementation of a myopia management clinic.
Aim
To present a case series of patients who attended a myopia management clinic continuously and to compare different methods of evaluating the efficacy of contact lens treatments.
Materials and Methods
The patient case series included data from a random sample of 15 patients using OK (OK1-OK5), MF (MF1-MF5) and DF contact lenses (DF1-DF5). The potential benefits and risks of the treatments available in the child’s prescription are discussed with the parent and child who then select their preferred treatment. Data were collected from the clinic records at the myopia management clinic, Glasgow Caledonian University, Scotland (January 2016-May 2021). All patients had provided consent to allow their data to be anonymised and to be used in research. Children are referred to the myopia management clinic from optometrists in the local community or orthoptists in the hospital eye service. There is no charge for appointments but treatments are chargeable and paid for by the parent. Treatments offered at the time of data collection were OK, DF (MiSight, Cooper Vision) and MF centre distance contact lenses (Biofinity multifocal (+2.50 add) and Proclear Multifocal toric (+2.50 add), Cooper Vision). The MF contact lenses are of a similar design. All patients are reviewed every 6-12 months pre-treatment and after initiation of treatment. Compliance is confirmed verbally with parents and the child. As AL growth rates are an important determinant of treatment success, there are a minimum of two AL measurements taken 6 months apart before treatment is initiated. This allows for the rate of axial elongation before treatment to be determined so that it can be compared to the rate of axial elongation after initiation of treatment. SER was calculated as sphere+(0.5xcyl). AL is measured at the clinic using the Zeiss IOL Master 500. A total of five measures are averaged from each eye with a signal to noise ratio of at least 2.0 as suggested by the manufacturer
1. Percentile method
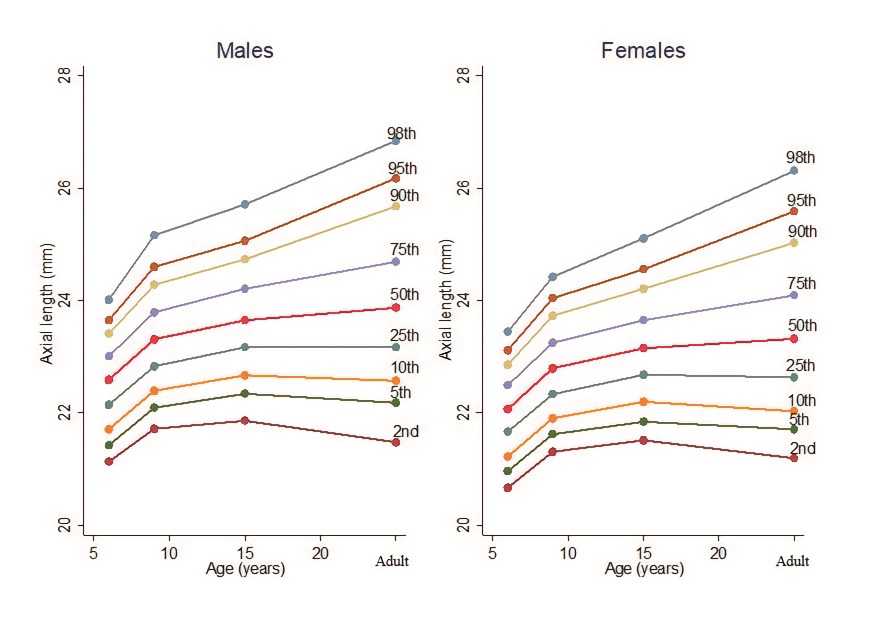
AL growth charts using population based data14 were applied to the case series (Figure 1). These growth charts illustrate change in AL with increasing age. Patient data were plotted against the growth curves to allow the reader a gross visual overview of the patient’s growth trajectory. Details of the data are presented in tables. This Percentile Method is based on the premise that if the patient’s rate of axial elongation reduces by at least one percentile on the growth chart, treatment is successful in slowing the rate of progression11. As changes in AL are typically small, it cannot be detected by visually inspecting the growth curves alone. Rather, the gradient (rate of axial elongation) for each percentile for each age range was calculated from published growth curve data14.
Gradient (rate of axial elongation/year)
= (AL (mm) at return visit – AL (mm) at baseline)
÷ (Number of years between the return visit and baseline)
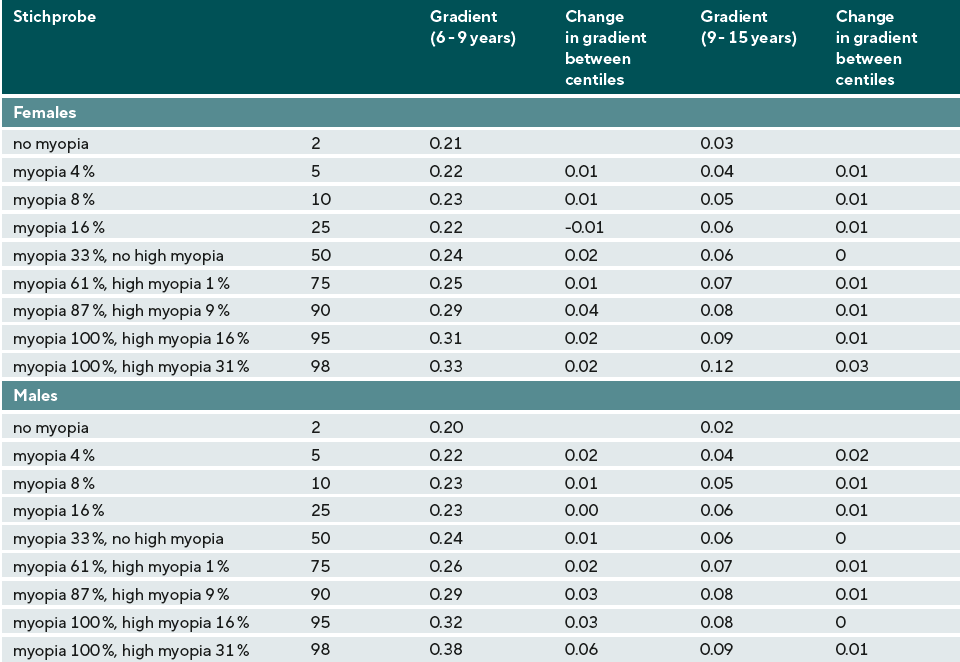
The difference between each percentile for each gradient was calculated by subtracting the gradient below from the gradient above, for example: 5th percentile-2nd percentile (Table 1). Treatment was deemed effective if the gradient of the patient’s AL data had decreased by one percentile as per the growth curve data14 in comparison to pre-treatment. For example, using Table 1, before treatment a 6-year-old female in the 90th percentile has a rate of axial elongation of 0.29mm/yr. This changes to 0.07mm/yr after initiation of treatment when aged 10 years. The rate of axial elongation is now in line with the 75th percentile indicating treatment is effective as the patient has dropped from the 90th percentile aged 6 years to the 75th percentile aged ten years. However, for children whose AL which fell outside of the upper 98th percentile, the change in gradient following treatment was compared to difference in gradient between the 98th and 95th percentiles. For example, a male patient aged 6 years with a baseline AL greater than the 98th percentile on the growth chart has a gradient of 0.29mm before treatment. This decreases to 0.23mm after initiation of treatment aged 8 years. The change in gradient is 0.06mm. Using Table 1, the change in gradient between the 98th and 95th percentiles for the ages of 6-9 years using growth curve data is also 0.06mm indicating that the rate of axial elongation has slowed by one percentile.
2. Mean Efficacy Method:
The rate of axial elongation per year after initiation of treatment was subtracted from the rate of axial elongation per year before treatment. This value was then compared to the difference in mean AL between treatment and control groups reported by literature. Treatment was determined to be effective if the change in the rate of axial elongation for the patient aligned with the expected change in rate per year: OK 0.14mm/year15, DF 0.08mm/year6, MF 0.11mm/year15
3. CARE Method
The rate of axial elongation at each 12-month interval after treatment initiation was calculated and subtracted from the annual rate of axial elongation before treatment. The sum of the difference in rate for each year after initiation of treatment was then calculated. The CARE value was then compared to the expected CARE value for that treatment: OK: 0.27mm over a two year period16, MF or DF: 0.28mm over a three year period3. If the patient’s treatment period exceeded the time period stated for that CARE value, the CARE value was multiplied by the number of years of treatment for that patient.
4. Emmetropic Growth Method:
The rate of axial elongation per year after treatment was compared to the expected rate of axial elongation per year in an emmetrope of the same age13 which ranged from 0.15mm/year for an 8 year old to 0.05mm/year for a 14-year-old. Treatment was determined to be effective if the rate of axial elongation after treatment aligned with the rate of axial elongation in an emmetrope.
5. SER Method
Optometry practices in the UK often do not have the equipment required to measure AL. Therefore, an alternative method using SER to evaluate treatment effectiveness is also required. The authors propose that a clinically meaningful change in the rate of SER progression of >+0.50D which exceeds normal variability of subjective refraction9 can be used as a target. This method was not applied to OK treatments.
Results
The baseline AL for all patients in the case series fell within +/- two standard deviations (SD) of the mean baseline AL of all patients attending the myopia clinic (24.84mm (SD 1.01) indicating these patients are representative from the myopia clinic database.
DF contact lens case series
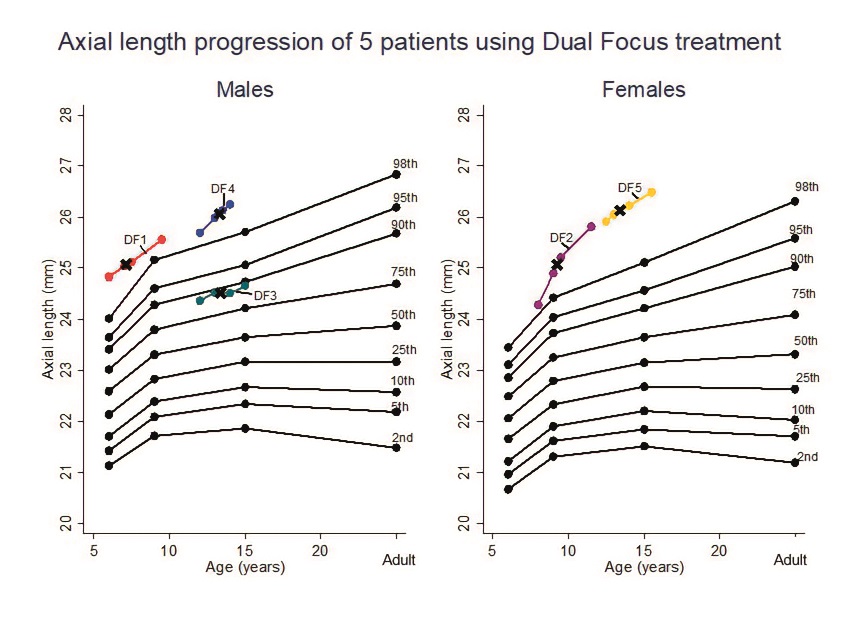
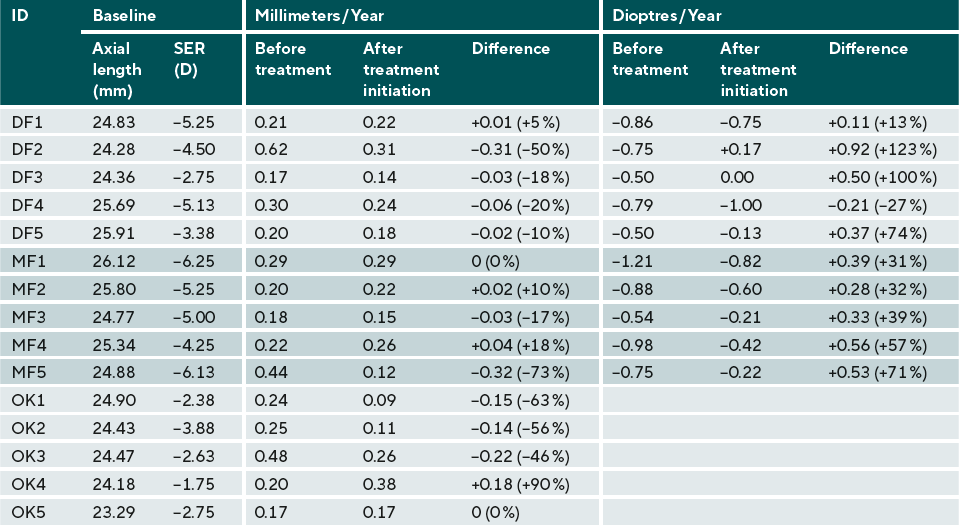
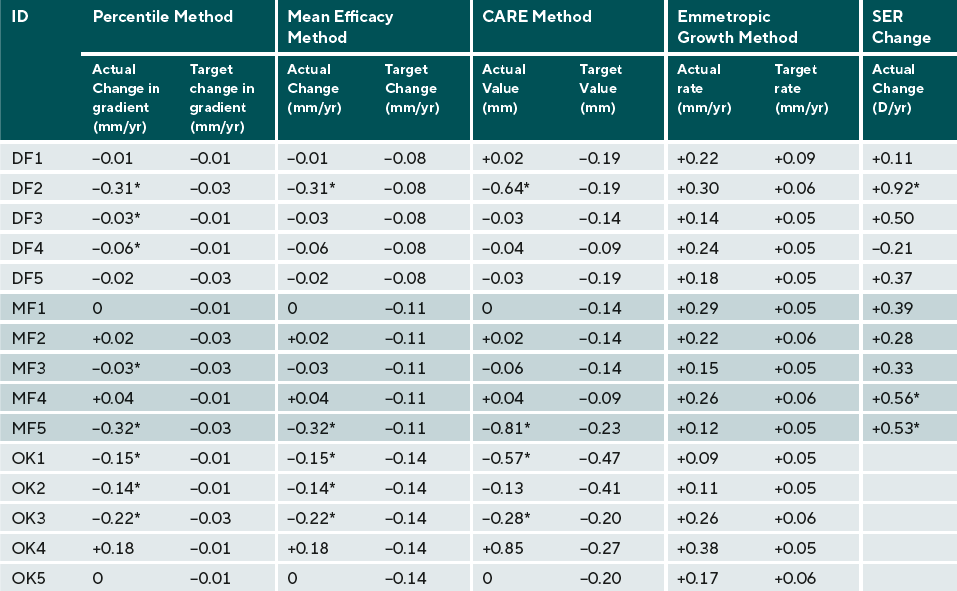
Data are presented in Figure 2 and Tables 2 and 3. Patients DF1-DF4 demonstrated a decrease in the rate of axial elongation which was equal to at least one reduction in percentile using the Percentile Method (#1). The difference in rate of axial elongation was in alignment with Mean Efficacy (#2) and with the CARE (#3) Method for patients DF1 and DF2. DF2 was the only patient with a significant reduction in SER progression (#5). None of the patients achieved the same rate of progression as an emmetrope (#4).
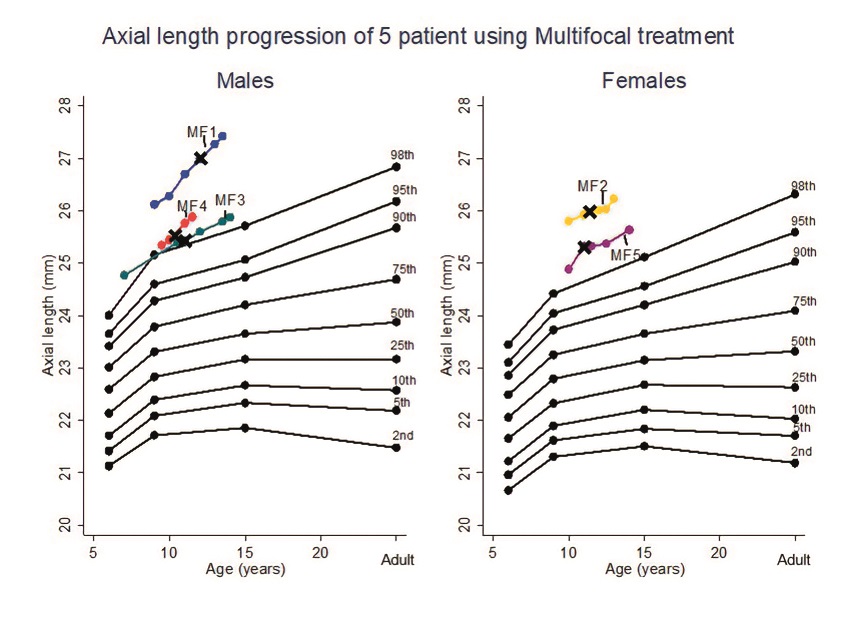
Multifocal contact lens treatment
Data are presented in Figure 3 and Tables 2 and 3. Patients MF3 and MF5 demonstrated a decrease in the rate of axial elongation after treatment which was equal to at least one reduction in percentile using the Percentile Method (#1). Patient MF5 demonstrated a decrease in the rate of axial elongation in alignment with the Mean Efficacy Method (#2), the CARE Method (#3) and the SER Method (#5). Patients MF1, MF2 and MF4 did not the meet the criteria for any of the methods. None of the patients achieved the same rate of progression as an emmetrope (#4).
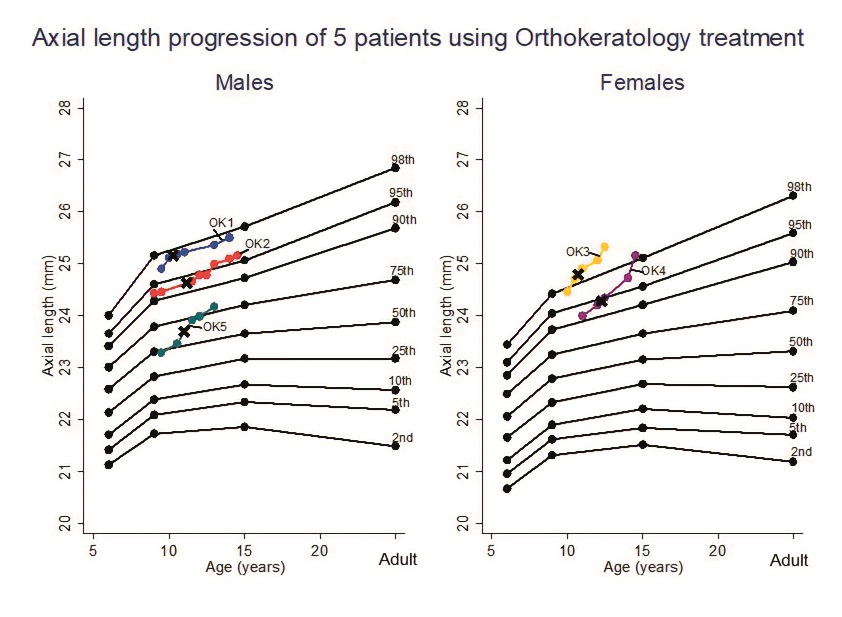
Orthokeratology
Data are presented in Figure 4 and Tables 2 and 3. Patients OK1-3 demonstrated a decrease in the rate of axial elongation after treatment which was equal to a reduction of at least one percentile using the Percentile Method (#1). Although patients OK1 and OK3 demonstrated a decrease in axial elongation in alignment with the Mean Efficacy Method (#2) and the CARE Method (#3), patient OK2 did not. Patients OK4-5 did not demonstrate a decrease in the rate of axial elongation. None of the patients achieved the same rate of progression as an emmetrope (#4). To summarise, treatment was deemed effective using the Percentile method for 53% of patients, using the Mean Efficacy Method for 33% of patients, using the CARE Method of 27% of patients, using the Emmetropic Growth Method for 0% of patients and using the SER Method for 20% of patients using DF or MF treatments.
Discussion
This case series compared five methods of determining treatment effectiveness. The Percentile Method has been previously utilised to explore the risk of myopia onset17 as well as determining treatment effectiveness11,18. Although many of the patients in the case series demonstrated a decrease in percentile, the difference in gradient between percentiles is small (average 0.01mm) and is less than the reported variability when measuring AL (0.026mm)10. The small differences in gradient of the AL growth curves demonstrate that the eye grows at a slow rate. This is particularly evident when compared to other childhood growth charts such as those used to monitor increase in head circumference19. The Mean Efficacy Method is quick and simple to use. However, the reporting of mean efficacy values by the literature is limited in that it does not account for the change in rate of axial elongation with age, changes in efficacy with time or the rate of myopia progression8. Despite this, the mean efficacy values reported by the literature more easily illustrate treatment effects as these values (0.08 to 0.14mm/year6,15) are greater than the change in gradients between percentiles noted in the growth curve data and the variability of the method used to measure AL (0.026mm)10. The CARE Method is a more robust method of expressing treatment efficacy8 than the Mean Efficacy Method and is independent of factors influencing axial elongation such as age and refractive error. In this case series, the Mean Efficacy Method and the CARE method were largely in agreement in identifying patients who had effective treatment.
None of the participants achieved the same axial elongation rates as those of age-matched emmetropes. This is likely due to the modest treatment effects seen in this case series. A significant reduction in SER progression was also not detected for many of the patients in the case series. This could be due to variability of subjective refraction meaning that small changes in myopia progression cannot be detected by monitoring SER only. Some of the patients in the case series did not display a decrease in myopia progression despite no concerns on non-compliance. As indicated by literature, the response to treatment may be variable with some children achieving no reduction in progression2,4,16 and up to 20% of children may continue to progress by 1D per year despite treatment with DF2, MF4 or OK contact lenses16. In agreement, a small cohort of predominantly Caucasian children reported that even in the first year of treatment, half of children had not responded to treatment using DF contact lenses20. Despite this, the range of percent reduction in axial elongation in children in the case series when wearing MF (17-73%), OK (46-63%) and DF (10-50%) contact lenses is of a similar range reported in literature2,6,21.
A number of the patients in the case series had a rate of axial elongation exceeding the expected rate from the growth curves or had an AL which was greater than the uppermost percentile. There are no currently no population based AL growth charts from Caucasian children which include data on longer ALs12-22. Despite this, the plotting of AL progression over time can be an excellent motivator for patients11, are useful in demonstrating the risk of high myopia and deciding if treatment should be initiated. From this case series the use of the Mean Efficacy or CARE methods were most suitable for short term clinical decision making. The patients from this case series were representative from the patient data base attending the clinic. However, further analysis would be appropriate to investigate this further in a larger optometric database.
Conclusion
In this case series, AL growth charts were not useful in monitoring myopia progression over the treatment period due to small differences between percentiles. None of the patients achieved a reduction in growth rate similar to that expected for an age-matched emmetropic eyes and monitoring SER alone was not sufficient to detect small changes in progression. The use of mean AL efficacy values or CARE value methods were the most suitable for short term clinical decision making.
Conflict of interest
The authors report no conflicts of interest and have no proprietary interest in any of the materials mentioned in this article. This research received no specific grant from any funding agency in the public, commercial, or not-for-profit sectors.