Objective measurement of intraocular lenses using the VirtIOL device
Purpose. The primary goal of this study was to evaluate the resolution of three different intraocular lenses using the
VirtIOL device. The secondary objective was to determine the contrast achieved by these lenses.
Material and Methods. An in-vitro assessment of three intraocular lenses (including a single vision IOL, a trifocal IOL and an EDOF IOL) was performed using the VirtIOL device. The key feature of this apparatus is a table-mounted device that allows the user to look through an IOL along the optical axis at a target at any distance. An industrial camera “UI-3040CP-C-HQ Rev.2 (AB02491)” (Co. Navitar, USA) was mounted on the chin rest of the VirtIOL. The USAF 1951 test chart was presented at the following distances: 6 m, 1 m and 0.4 m. The IOLs were each mounted in a model eye. The resolution capability, expressed as line pair per mm [lp/mm] and contrast values were measured under photopic conditions at a system aperture of 3 mm. The measurement of the contrast values was repeated ten times with each lens at each distance.
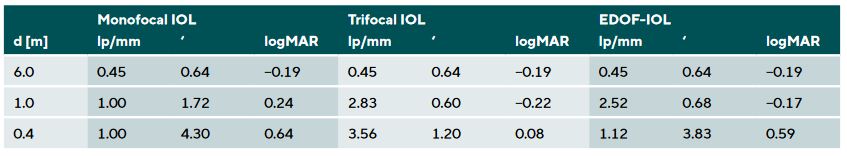
Results. All IOLs (monofocal/trifocal/EDOF) achieved a resolution of 0.445 lp/mm at a distance of 6 m, as well as
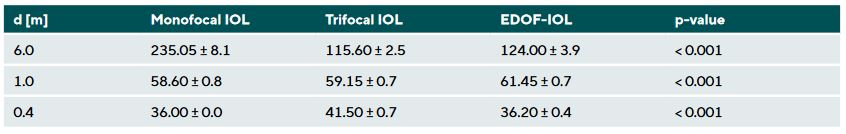
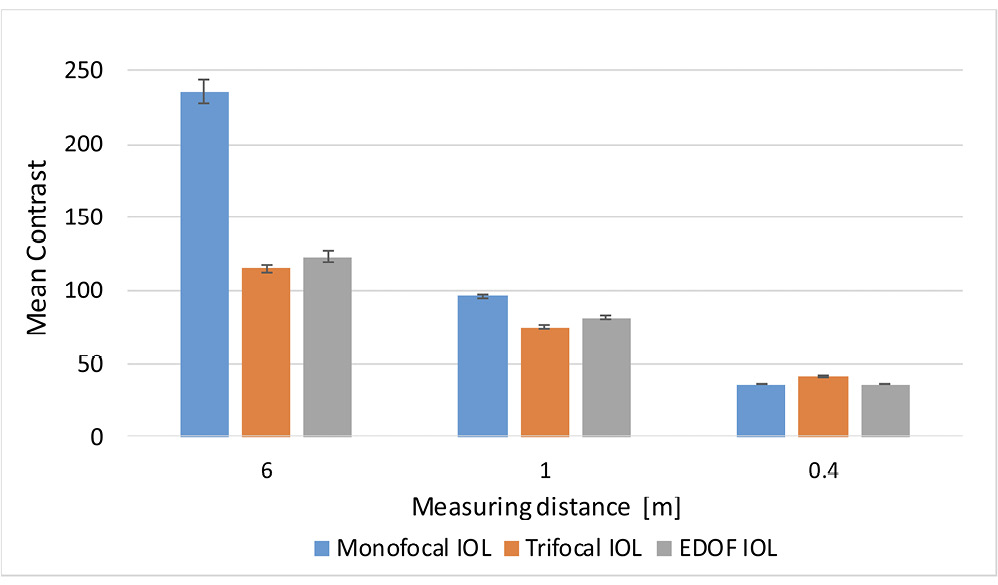
1.00 / 2.82 / 2.52 lp/mm at 1 m. The measurement of resolution at the distance of 0.4 m resulted in 1.00 / 3.56 / 1.12 lp/mm. At various test distances, the following mean contrast values and standard deviations were obtained: 236 ± 8.1 / 115 ± 2.5 / 123 ± 3.9 (p < 0.001) at 6 m, 96 ± 0.8 / 75 ± 0.7 / 81 ± 0.7 (p < 0.001) at 1 m and 36 ± 0/ 42 ± 0.7 / 36 ± 0.4 (p < 0.001) at 0.4 m.
Conclusion. The VirtIOL device in combination with the measuring camera used provides a basis for objective measurements of IOLs. The resolution capability of the three IOLs increases with decreasing distance, whereas the contrast values decrease. This study confirms the usefulness of the setup and provides a basis for further evaluations of intraocular lenses with the VirtIOL device.
Introduction
The design of an intraocular lens (IOL) begins with software-supported modelling based on the optical requirements and is followed by the use of manufacturing expertise and the development of eye models.1,2 In this context, artificial eye models are already being used to predict the image quality of newly developed IOLs and to understand their optical performance.1–4 The testing of new IOL designs on an optical bench is carried out using model eyes, which should comply with the requirements of DIN EN ISO 11979-2: 2014.5 One disadvantage of these measurements is that they are based on numerous assumptions.6,7 However, these measurements are relatively easy to perform and require significantly fewer resources than clinical studies.
Measuring IOLs using an optical bench was developed and carried out in order to compare the results of clinical studies with objective results.8–10 A further development of the optical bench is, for example, the Rassow telescope 11 which was compared with the VirtIOL instrument in a study by Wahl et al. in 2019. The study showed that there is only a slight correlation between the values recorded by the two measuring devices.12 However, the basic structure of both devices is very similar: an intraocular lens is inserted into a compact optical bench and presented to the test subject.11,13 The VirtIOL device, developed by Dr Sergio Luque, also has a similar structure in which a real IOL can be tested using a virtual image in the iris plane.14
Clinical trials are essential to ensure patient safety.15 However, these are very cost-intensive and time-consuming, meaning that not every IOL prototype can be clinically tested. The virtual implantation of IOLs could therefore present an excellent alternative for preclinical evaluation. The method is suitable for purely objective use but also with test subjects. The objective use will be presented in this study.
Aim
The aim of this experimental study was to determine the resolution and contrast value of a measurement software for three different IOLs using the in-vitro measurement set-up of the VirtIOL device. The specifications of DIN EN ISO 11979-2:2014 were observed when collecting the data.
Material & Methods
VirtIOL
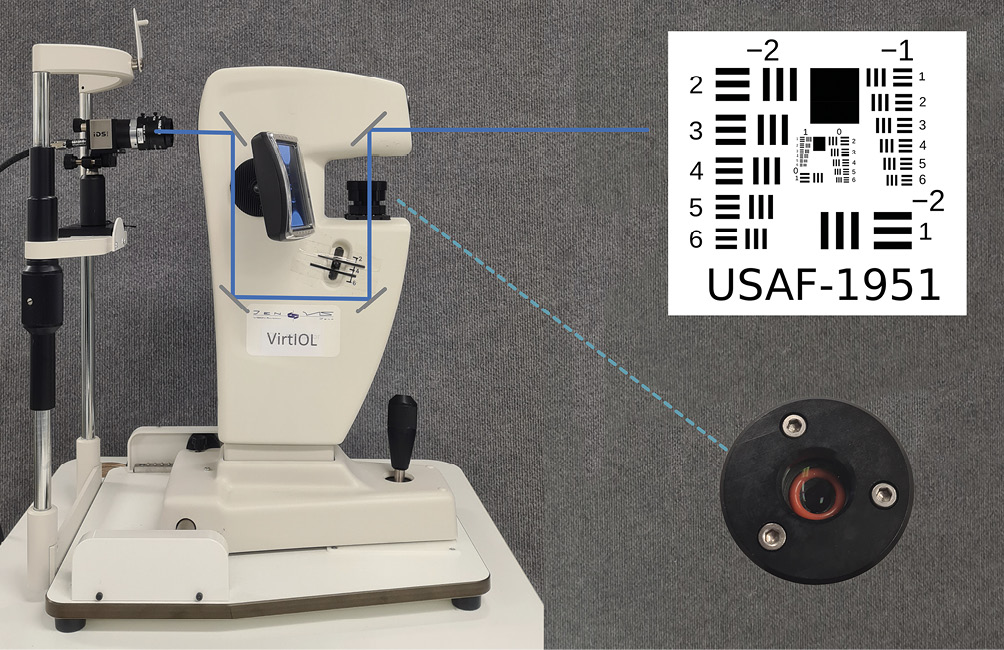
The VirtIOL (10Lens S. L. U., Terrassa, Spain) is a device developed by the engineer Sergio Oscar Luque for the virtual implantation of IOLs. It enables the evaluation of imaging properties without surgical intervention. The VirtIOL device is a compact optical bench that shows a test object along the optical axis in the entrance pupil of the measuring camera. This allows for the assessment of the imaging quality of the IOL. When a test pattern is displayed by the measuring system, the beam path passes through the IOL integrated in a model eye before it is mapped onto the entrance pupil of the measuring camera via lenses, diaphragms, and mirrors. An aperture size of 3 mm is used in the device in accordance with DIN EN ISO 11979-2:2014. In addition to monofocal lenses, the device can also be used to measure multifocal and toric lenses (Figure 1).
The original idea of inventor Sergio Luque was to give cataract patients the opportunity to subjectively test the image quality of IOLs before implantation.14 The advantage of the device is that it offers patients the possibility to test and compare potential intraocular lenses in a short period of time before they undergo a surgical procedure to replace the natural eye lens with an artificial lens. A disadvantage of the device is the dependence of its measurement accuracy on clear media and the need for high visual acuity to differentiate between intraocular lenses.
The test lenses
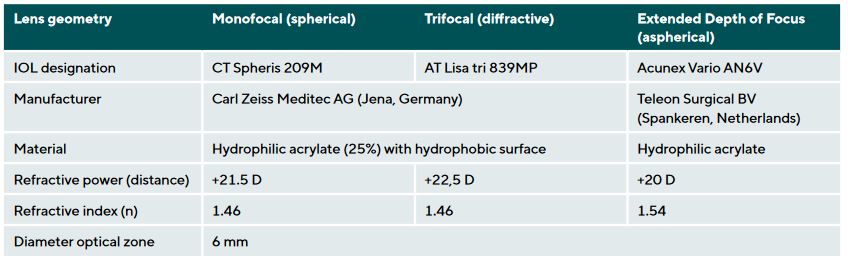
Three different IOLs with different lens geometries were measured to determine the imaging quality. A monofocal, a trifocal and an extended depth of focus (EDOF) IOL were used (Figure 2). All IOLs were focussed in the model eyes for the test distance of 6 m. The corresponding characteristics are shown in Table 1.
Model eye
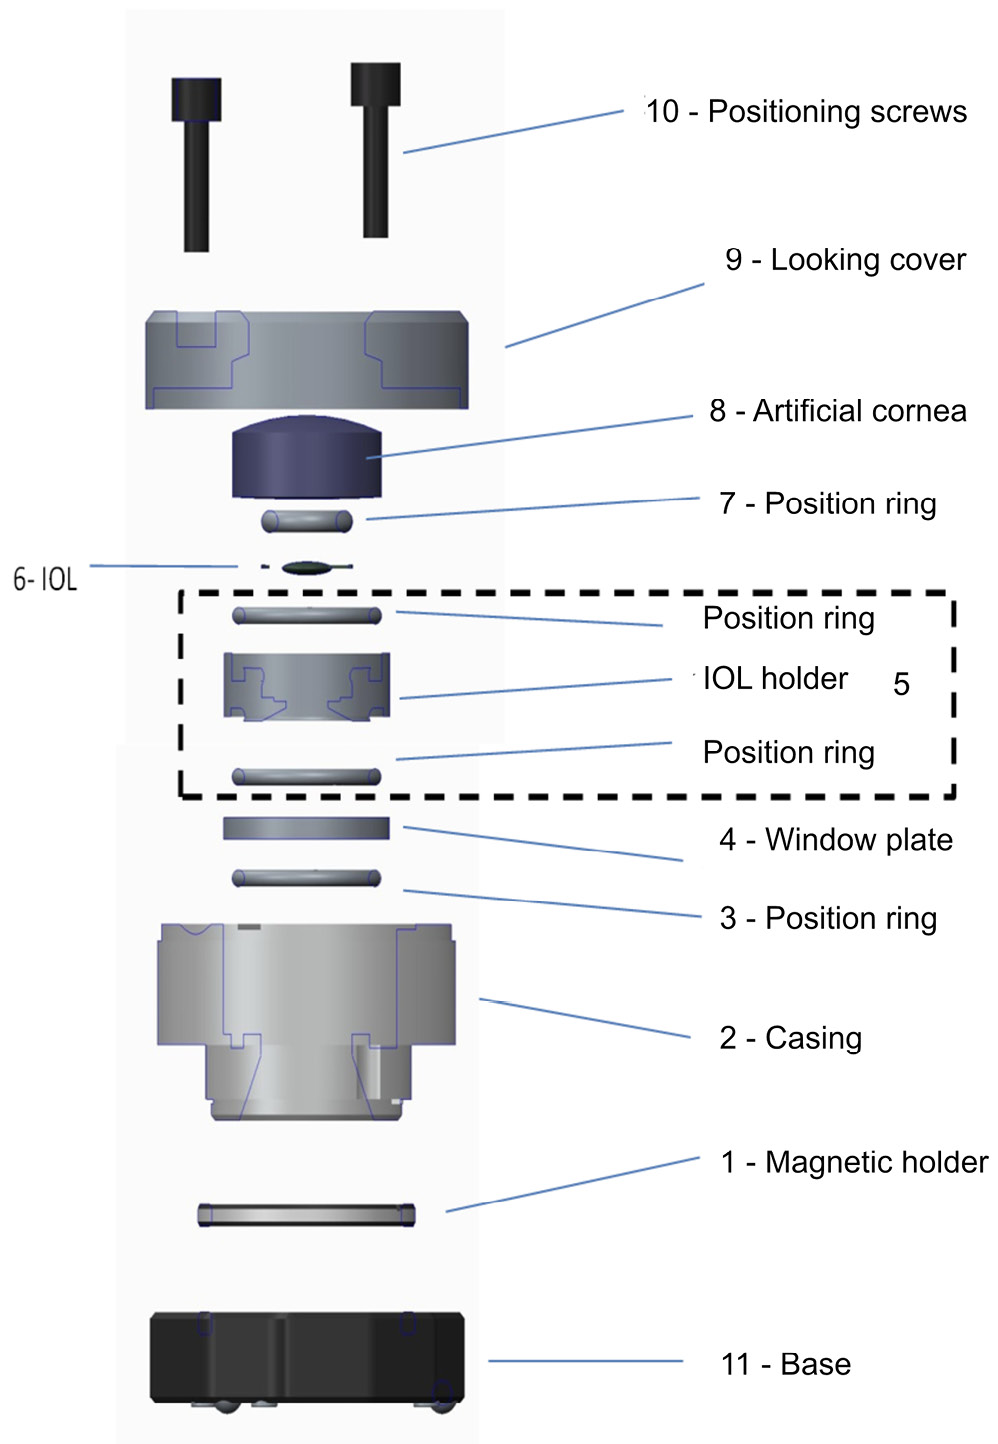
The first step of the setup was to insert the intraocular lenses into the model eye. This represents a simplified replica of a biological eye, including a convex model cornea (No. 8; Figure 3). The inserted IOL is surrounded by distilled water as an immersion solution. In this context, it was important to avoid air bubbles in the entire system when inserting the lens into the model eye.
To focus the three model eyes, the lens of the measuring camera first had to be adjusted to the target distance of
6 metres. The camera was then mounted behind the VirtIOL and centred. In the next step, the IOLs, which were inserted in the model eyes, were positioned individually in the VirtIOL. The distance to the base was adjusted by rotating the magnetic holder allowing the IOL to be focussed on the target distance of 6 m. To do this, the entire system was first defocussed beyond the focal point (fogging). The fogging was then slowly reduced until a sharp image was obtained. The magnetic holder was then locked in place to prevent any further unintentional adjustment. Under photopic conditions, the total aperture of the VirtIOL instrument was limited to 3 mm.
Data collection
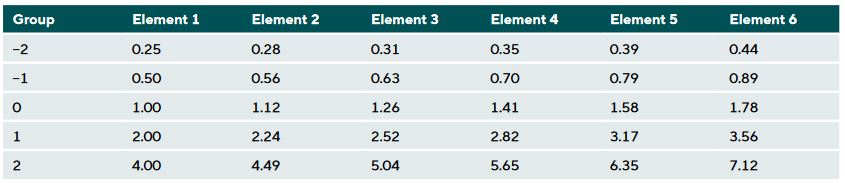
The 1951 USAF resolution test pattern was used to collect the data in accordance with the specifications of DIN EN ISO 11979-2:2014. This test chart was used by the US Air Force in 1951 to evaluate the imaging quality of optical systems such as aerial cameras. It is the simplest way of determining the limiting resolution of an optical element. Even today, the process is still based on the military standards valid at the time in accordance with MIL-STD-150A20. The test pattern consists of black and white bar groups, which are applied to the glass of the test chart using a chrome alloy. As can be seen in Figure 1, a bar group consists of six elements, which, in turn, are made up of three horizontal and three vertical bars. The length of the bars is in a ratio of 5 : 1 to their width. The resolution requirement of an optical element doubles as the group number increases, whereas the size of the bars is halved. The resolution can be calculated using the group and element number of the test pattern or read from Table 2. The higher the value, the better the spatial object resolution. In this study, the measured values of the IOL were read by a trained examiner who had already participated in previous studies.
The contrast values of the IOLs were measured on Landolt rings of an EDTRS chart repeating the measurement ten times. The „uEye-Cockpit“ program (IDS, Obersulm, Germany), version 4.95, was used to calculate the contrast value. Using this program, it is possible to simultaneously control the industrial measuring camera. The measuring camera „UI- 3040CP-C-HQ Rev.2 (AB02491)“ was complemented with the lens from Navitar (Rochester, USA). Both, the resolution capability and the contrast values were measured for all intraocular lenses at distances of 6 m, 1 m and 0.4 m.
Statistical analysis
The data was analysed using the SPSS statistics program (version 26, IBM, Armonk, USA). Both, the mean value and the simple standard deviation were determined descriptively from the contrast values collected. The Shapiro-Wilk test was used to test for normal distribution. In addition, we performed a one-way ANOVA. The significance level was 5 % (α = 0.05).
Results
All three IOL designs showed statistically significant differences in the measured contrast values (Table 3). In addition, the contrast values and the corresponding standard deviation increased with increasing distance between the measurement system and the test pattern.
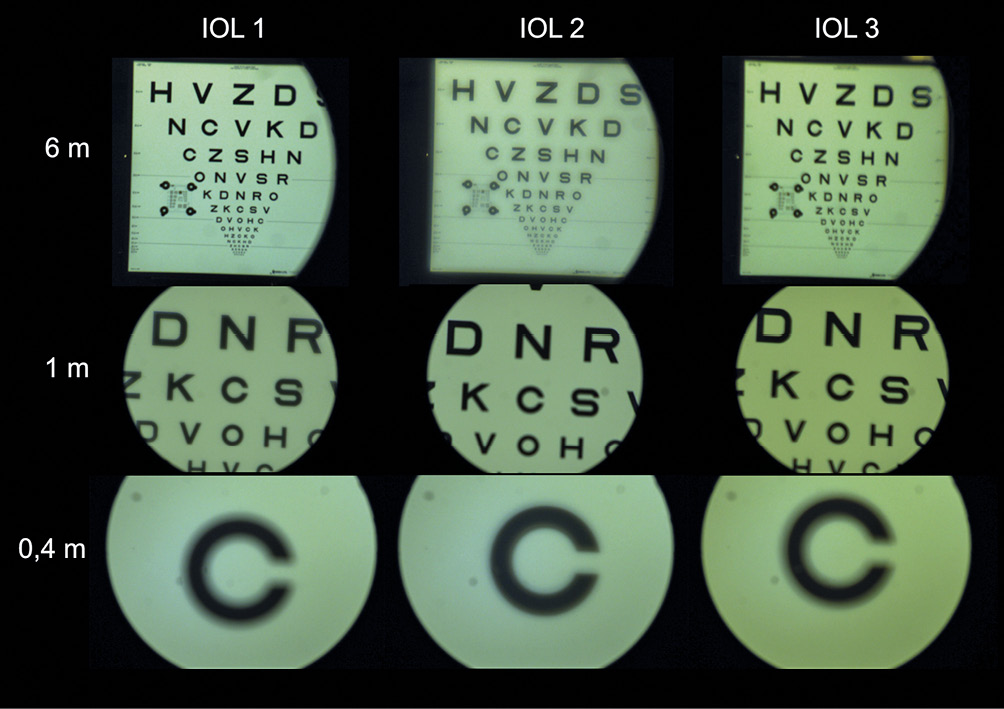
The results for the two analysed parameters of contrast and resolution capability are shown in Figures 4 and 5. The three IOL designs are compared in the respective diagrams. Figure 3 also shows error bars corresponding to the simple standard deviation. It can be seen that the standard deviation decreases with decreasing measurement distance. Figure 6 also shows the image qualities of the three IOLs as a function of the measuring distance using the EDTRS chart.
Discussion
In their study, Son et al. compared different designs of monofocal and multifocal IOLs based on the modulation transfer function (MTF) 21 and the optical beam propagation. The monofocal lens has an MTF value at the far point that doubles that of the multifocal IOL (MIOL).22 In this context, the higher the MTF value, the higher the contrast. The contrast values obtained in the series of measurements presented in this article corroborate the results of Son et al. In a comparison of the mean values of the contrast measurements, the monofocal lens achieved the highest value for the largest distance. This can be explained by the design of the IOL, in which incident light is only collected in one focal point. Both, the trifocal and EDOF IOLs achieved comparable values. With decreasing distance between the measuring camera and the test pattern, the trifocal and EDOF IOLs dominated over the monofocal lens. Especially at a distance of 0.4 m, the trifocal IOL achieved the highest contrast value, which can also be explained by the design of the lens. In contrast, the EDOF lens achieved a slightly higher contrast value than the trifocal IOL at the largest distance and in the intermediate range. In addition, the standard deviations were found to decrease as the measuring distance was reduced. This is due to the selectable measuring range of the software, which is greater at a larger distance than at close range. In the latter case, measurements are taken repeatedly at one point, whereas at a larger distance, the smallest changes in position result in a higher variance of the individual measured values.
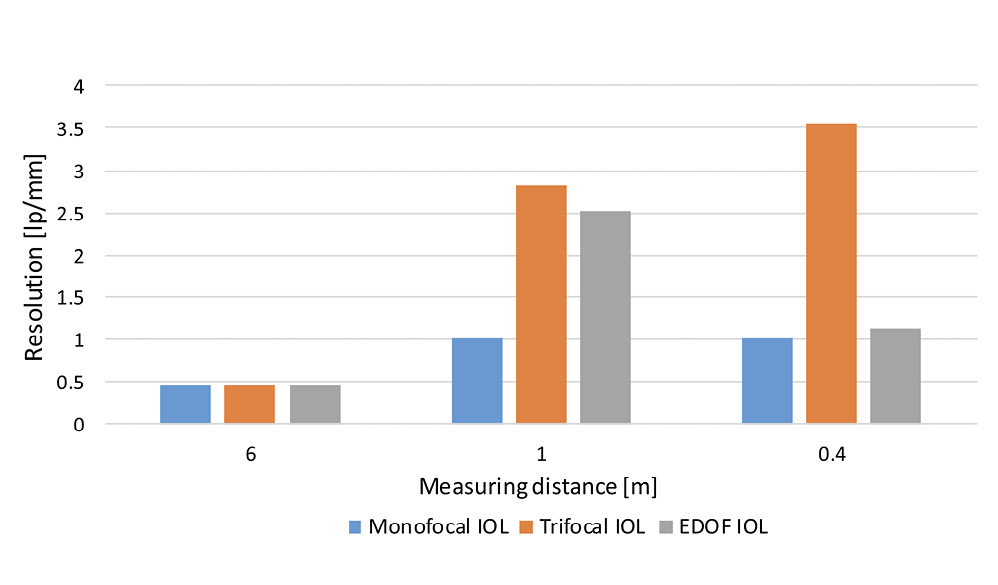
In terms of resolution capability, all IOLs achieved the same resolution at a measuring distance of 6 metres. Based on various studies in patients 23,24 or via objective data collection, a difference between the results of all IOL designs should be identified. One possible reason for the same maximum value for all IOLs in this paper is the reduced resolution capability of the measuring camera used, with which only optotypes up to a visual acuity of 2.0 or −0.3 LogMAR can be resolved. A comparison of the resolution results showed that they increased continuously as the measuring distance decreased. The resolution increased for the monofocal and EDOF IOLs up to the intermediate range before falling at close distance.
In contrast, the resolution capability of the trifocal IOL increased steadily up to the near range and reached a value three times as high as the other two lenses. In particular, the values of the monofocal and EDOF IOLs were similar at close range. In various studies, the resolution capability of the EDOF IOL at short distances was rated by patients as both, satisfactory 25 as well as inadequate.26 This shows the wide range of effects of lens geometries and the subjective perception of patients.
However, it should be noted in this discussion that the VirtIOL instrument uses components of the optical bench such as lenses, apertures or mirrors which are located between the measuring camera and the object. Each of these elements causes light to lose intensity and impairs the image quality. In addition, the limited resolution capability of the industrial measuring camera used must also be considered. For a distance of e. g. 6 metres, this camera could only document the resolution of the IOL to a limited extent. Figure 6 also shows the imaging qualities of the three IOLs as a function of the measuring distance using the EDTRS chart.
Conclusion
The resolution capability measured objectively with the VirtIOL device in combination with the measuring camera used provides a basis for the objective measurement of IOLs. The resolution capability of the three IOLs increases with decreasing distance, whereas the contrast values decrease. This study confirms the usefulness of the basic set-up and provides a foundation for further evaluations of intraocular lenses with the VirtIOL device.
Conflict of interest
The authors have no conflict of interest with respect to the methods and devices mentioned in the article.

Modern Intraocular Lenses. J. Cataract Refract. Surg., 18, 607–613.
Hwang, H. S. (2022). A Novel Intraocular Lens Simulator That Allows Patients to Experience the World Through Multifocal Intraocular Lenses Before Surgeries. Transl. Vis. Sci. Technol., 11:14.
(2020). Ray Propagation Imaging and Optical Quality Evaluation of Different Intraocular Lens Models. PLoS One, 15:e0228342.