Temperature-dependent measurement of soft contact lens parameters
Purpose: The study objective was to measure the temperature-dependent change in the refractive index, base curve, and back vertex power of soft contact lenses.
Material and Methods: For each material group according to ISO 18369-1 a representative soft contact lens brand was selected according to ISO 18369-1 (polymacon, nelfilcon A, ocufilcon D, balafilcon A, somofilcon A, lotrafilcon B). The parameters were measured in vitro at 20 °C and 35 °C. First, the refractive index was determined using the automatic refractometer (VariRef C, Schmidt + Haensch), followed by the base curve measurement using the OCT (is830, Optimec) in conjunction with the temperature controller (TC20i, Opitmec). The back vertex power difference was determined using the precision lens meter (NIMO TR1504, Lambda-X SA).
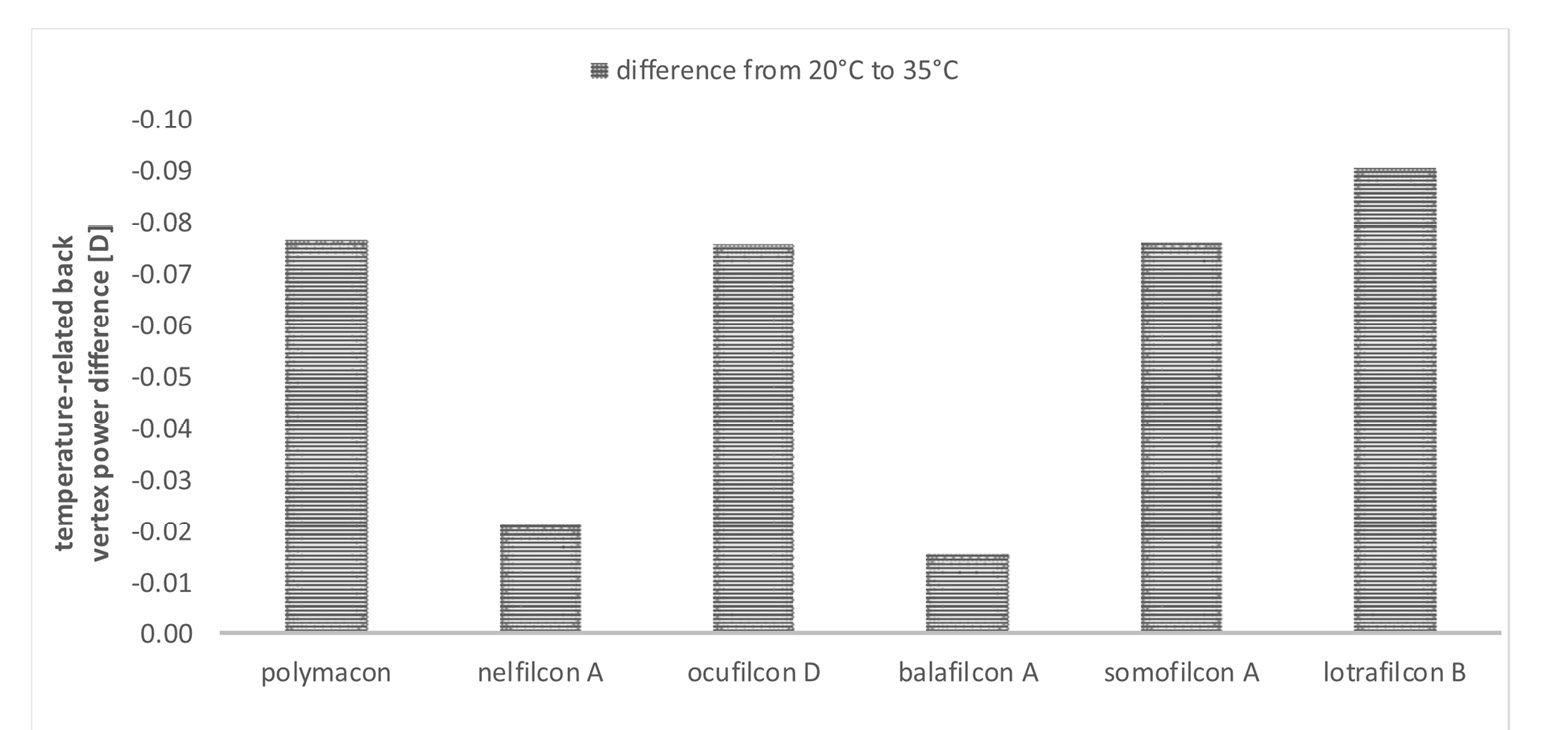
Results: The following values (refractive index 20 °C // refractive index 35 °C; base curve 20 °C // base curve 35 °C; Δ back vertex power from 20 °C to 35 °C) were obtained for the hydrogels polymacon (1.4464 // 1.4430; 8.4706 // 8.4240; −0.077 D), nelfilcon A (1.3875 // 1.3870; 8.7854 // 8.5817; −0.022 D), ocufilcon D (1.4198 // 1.4171; 8.5622 // 8.4647; −0.076 D) and the silicone hydrogels balafilcon A (1.4197 // 1.4196; 8.7205 // 8.8287; −0.016 D), somofilcon A (1.4024 // 1.4004; 8.9100 // 8.6800; −0.076 D), lotrafilcon B (1.4246 // 1.4212; 8.6791 // 8.5801; −0.091 D). All materials except balafilcon A showed a statistically significant change (p < 0.05 paired samples), related to at least two of the measured parameters.
Conclusion: The materials showed a reduction in refractive index and base curve with temperature increase. The back vertex power became more negative. The changes are within the tolerances specified in ISO 18369-2. Since no clinically relevant parameter changes were observed between the different temperatures, it is acceptable to continue the current practice and measure lens parameters at room temperatures.
Introduction
The measurement of relevant contact lens parameters such as refractive index, base curve and back vertex power are described in ISO 18369-3.1 Contact lens manufacturing tolerances are ± 0.005 for refractive index, ± 0.20 mm for base curve and ± 0.25 D for back vertex power.2 Measurements were carried out at an ambient temperature of 20 °C (68 °F), whereas the applicable tolerances are also established for this temperature. However, this environmental condition is in direct conflict with the actual intended use, as the surface temperature of the cornea is 35 °C (95 °F).3–6 The increased temperature may contribute to multifactorial dehydration of soft contact lenses and thus modify fitting-relevant parameters. The refractive index increases due to the lens being compacted, effect caused by the reduced water content in the material.7,8 The base curve is reduced due to volume reduction 9,10 and the back vertex power of the contact lenses becomes more negative depending on the other parameters.11 A further consequence of dehydration is a decrease in elasticity and an increase in stiffness, resulting in reduced wearing comfort.12 Therefore, it is important to differentiate between the labelling of the manufacturer regarding refractive index, base curve and back vertex power. The parameters are presented by the manufacturers on the contact lens blisters and secondary packaging. They are used to select the correct contact lens for the customer considering the shape of the cornea and the existing refractive error.
According to the ISO 18369-1, soft contact lenses are divided into hydrogel and silicone hydrogel groups. The materials essentially exhibit differences in water content, ionicity and permeability. The addition of hydrophobic silicone causes less dehydration compared to pure hydrogel contact lenses.10,13,14 Therefore, it is of interest to see determine how the different material properties affect the change in contact lens design parameters as a function of temperature.
Aim of the study
The study’s goal was to determine the difference in refractive index, base curve and back vertex power of soft contact lenses as a function of temperature. Accordingly, three hydrogel and three silicone hydrogel materials were measured at the ISO 18369 measuring temperature of 20 °C and at the eye temperature of 35 °C. Each material is representative of a group out of the ISO 18369 material group classification.
Material and Methods
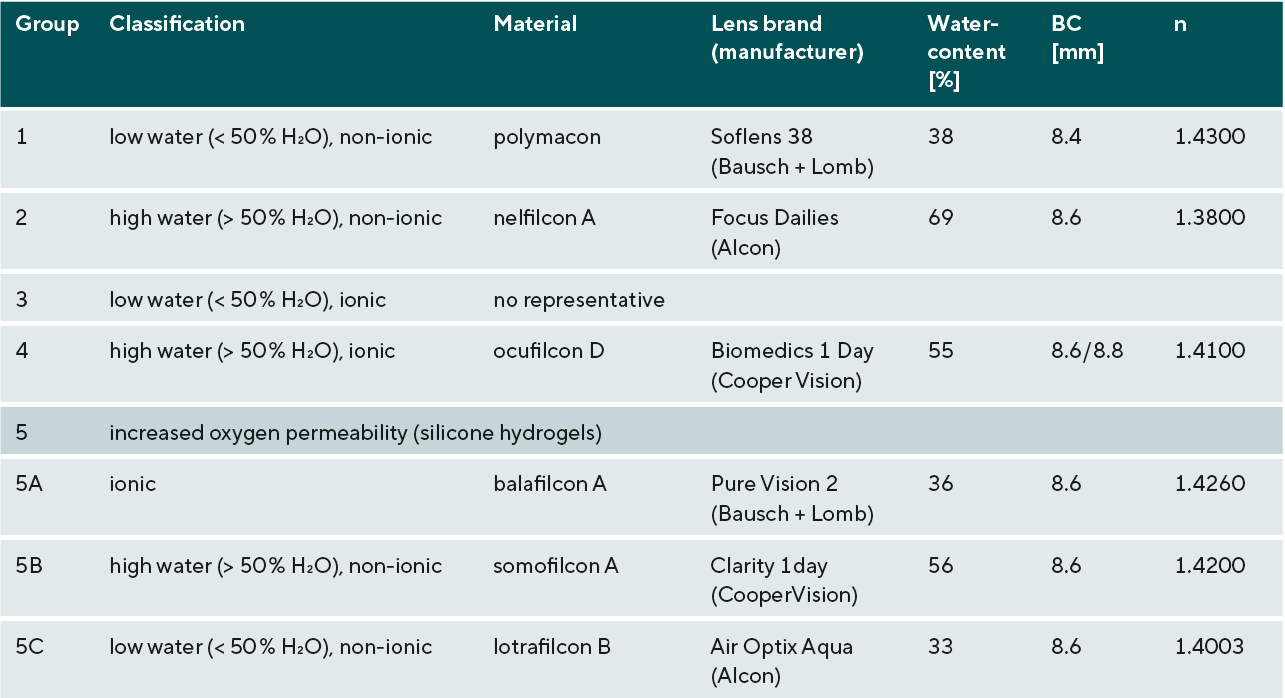
A representative brand of soft contact lenses with a power of −3.0 D was selected from the soft materials groups defined in ISO 18369-1.15 This included three hydrogel materials (polymacon, nelfilcon A, ocufilcon D) and three silicone hydrogel materials (balafilcon A, somofilcon A and lotrafilcon B). No representative contact lens brand was available out of material group 3. The characteristics of each selected contact lens are listed in Table 1.
First the refractive index, then the base curve and finally the temperature-dependent back vertex power difference were determined in vitro. New contact lenses from the same batch were used for each measurement method. The contact lenses were removed from the original blister solution. In the following, the measurement methods are described individually according to the measurement sequence.
Refractive index measurement
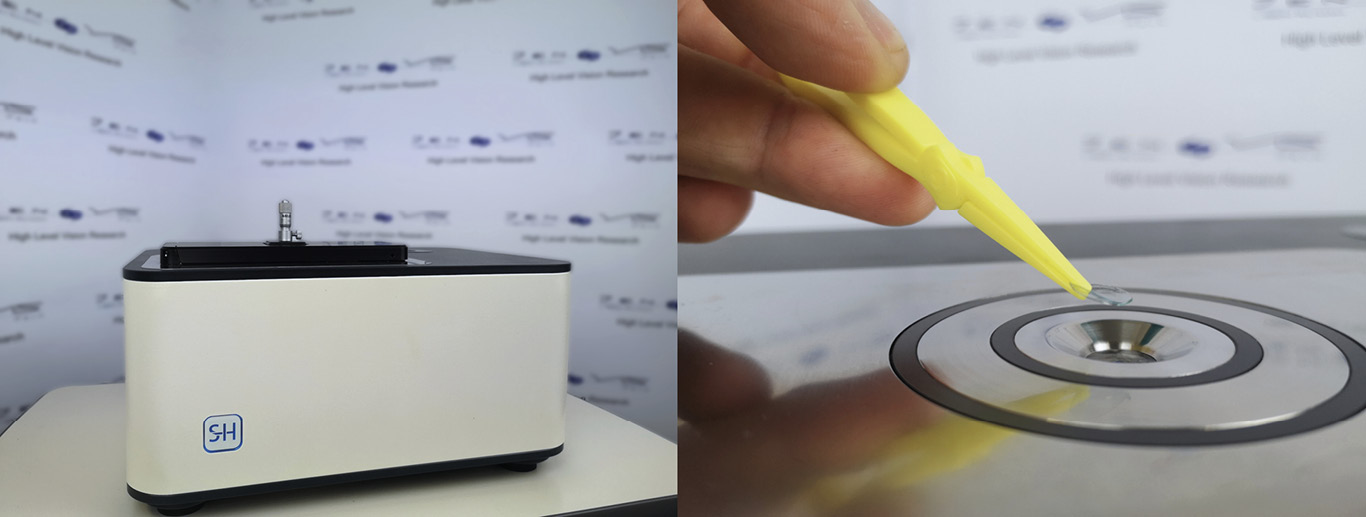
The refractive index was measured using the VARIREF C automatic refractometer (Figure 1). The measuring device has a closable, temperature-controlled measuring chamber and is thus shielded from external influences. The samples were pressed onto the measuring prism using a flat plunger. The lenses were removed directly from the blister solution, cleaned of excess liquid by means of WHATMAN 100 paper and prepared for the size of the measuring chamber using a circular punch. Each lens was first measured at room temperature (20 °C), then returned to the blister solution for five minutes to let it equilibrate, and finally measured again at eye temperature (35 °C). Five lenses were measured per lens material including 20 measurements per lens for each temperature setting.
Base curve determination
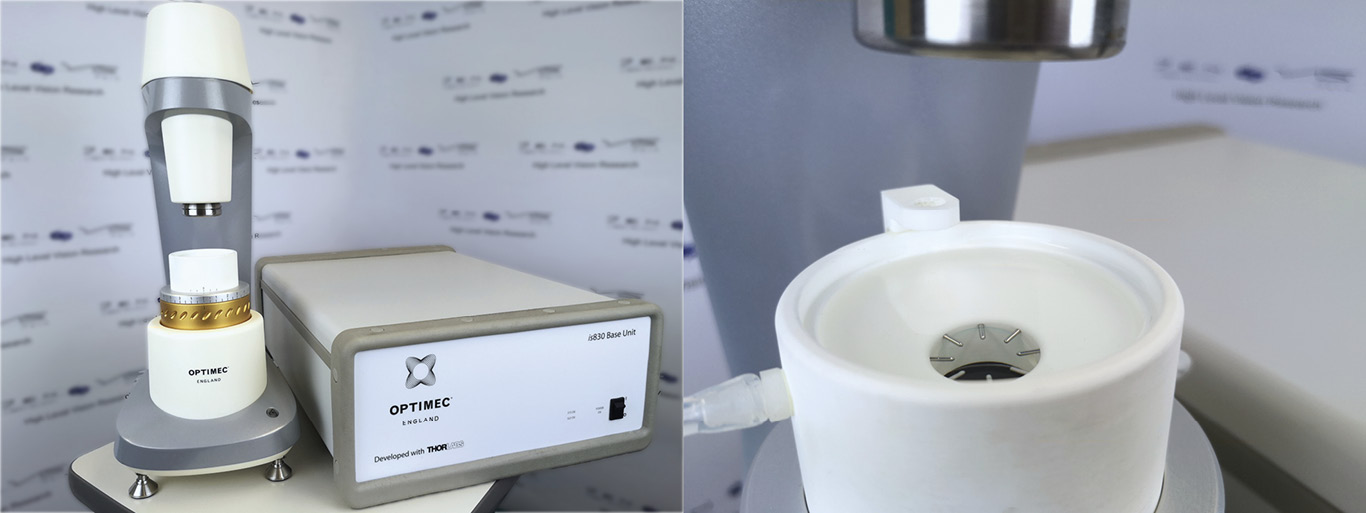
The base curve was determined in immersion by a non-invasive OCT method. Temperature control of the immersion liquid was performed using a temperature regulator (TC20i, OPTIMEC, UK). The determined temperature-dependent and material-specific refractive indices were directly incorporated into the base curve measurements, as these were required for the used OCT [(is830, OPTIMEC, UK) Figure 2]. After five minutes of equilibration, centration was performed and checked using a built-in camera. If this was correct, the OCT sectional images were taken and the measurements were automatically read. For each contact lens material, five lenses were measured five times each at 20 °C and 35 °C. Measurements were started at 20 °C. The lenses were then heated up in the filled wet cell and measured at 35 °C. A total of 25 measurements per temperature were taken for each lens material.
Back vertex power difference determination
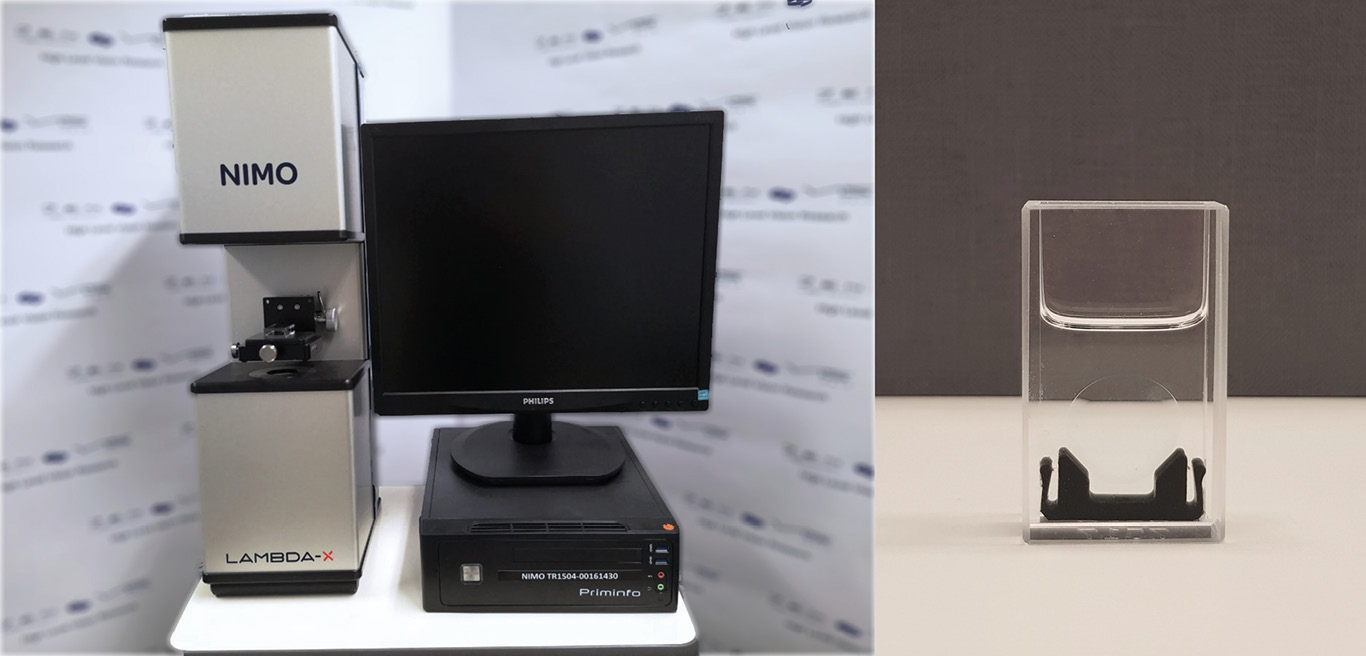
The temperature dependence of the back vertex power was determined using the stationary deflectometer (NIMO TR1504, LAMBDA-X SA, Belgium) based on the phase-shifting-schlieren technique.16 This provides a high-resolution investigation of the wave front, so that a back vertex power can be reliably determined up to the third decimal place. Since the device (Figure 3) has no temperature control, the temperature-dependent parameters of the previously measured refractive index and base curve for 20 °C and 35 °C were entered into the measurement software and used to survey the back vertex power. Each contact lens was placed in a saline filled cuvette using tweezers. The cuvette was fitted with a centring aid, which centred the contact lens by gravity. Three lenses were measured per contact lens material and ten measurements were taken per contact lens.
Statistical analysis
The statistical evaluation was performed with the statistical software SPSS version 26. An outlier correction was carried out for the results of the base curve. The mean value was calculated from the collected data for each target variable and the temperature dependence determined for the back vertex power. A test for Gaussian distribution was carried out with the Shapiro-Wilk test. The parametric t-test (normally distributed data) and the non-parametric Wilcoxon test (non-normally distributed data) were used as paired sample statistical tests at a significance level of α = 0.05.
Results
All data sets were normally distributed, except for the nelfilcon A material at both temperatures. The results with the corresponding temperature of the measurements are shown in Table 2.
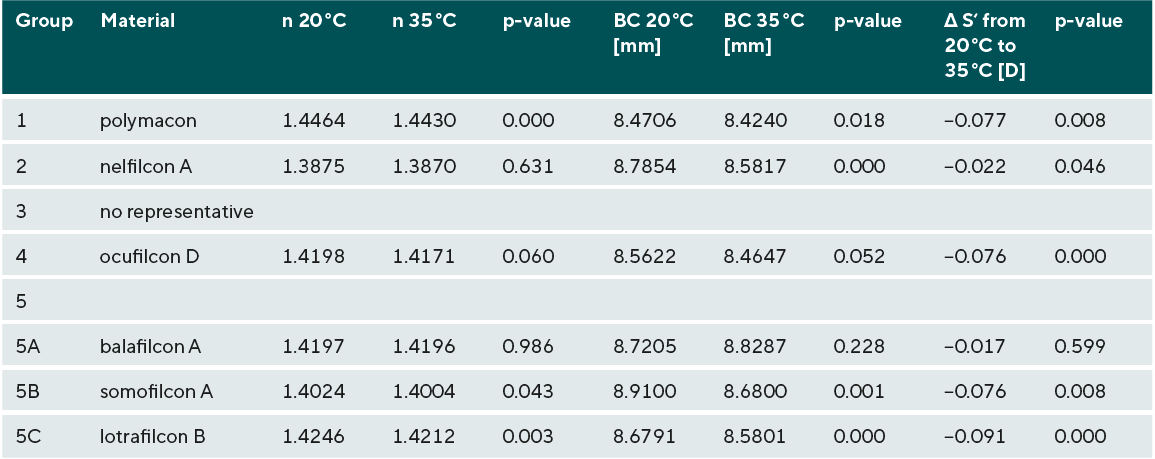
The contact lens materials polymacon, somofilcon A and lotrafilcon B showed significant differences of all three measured parameters at the two temperatures. Ocufilcon D showed a significant difference in back vertex power, whereas Nelfilcon A exhibited significant differences in the base curve and the back vertex power. The refractive index and the base curve decreased with an increase in temperature, whereas the back vertex power became more negative.
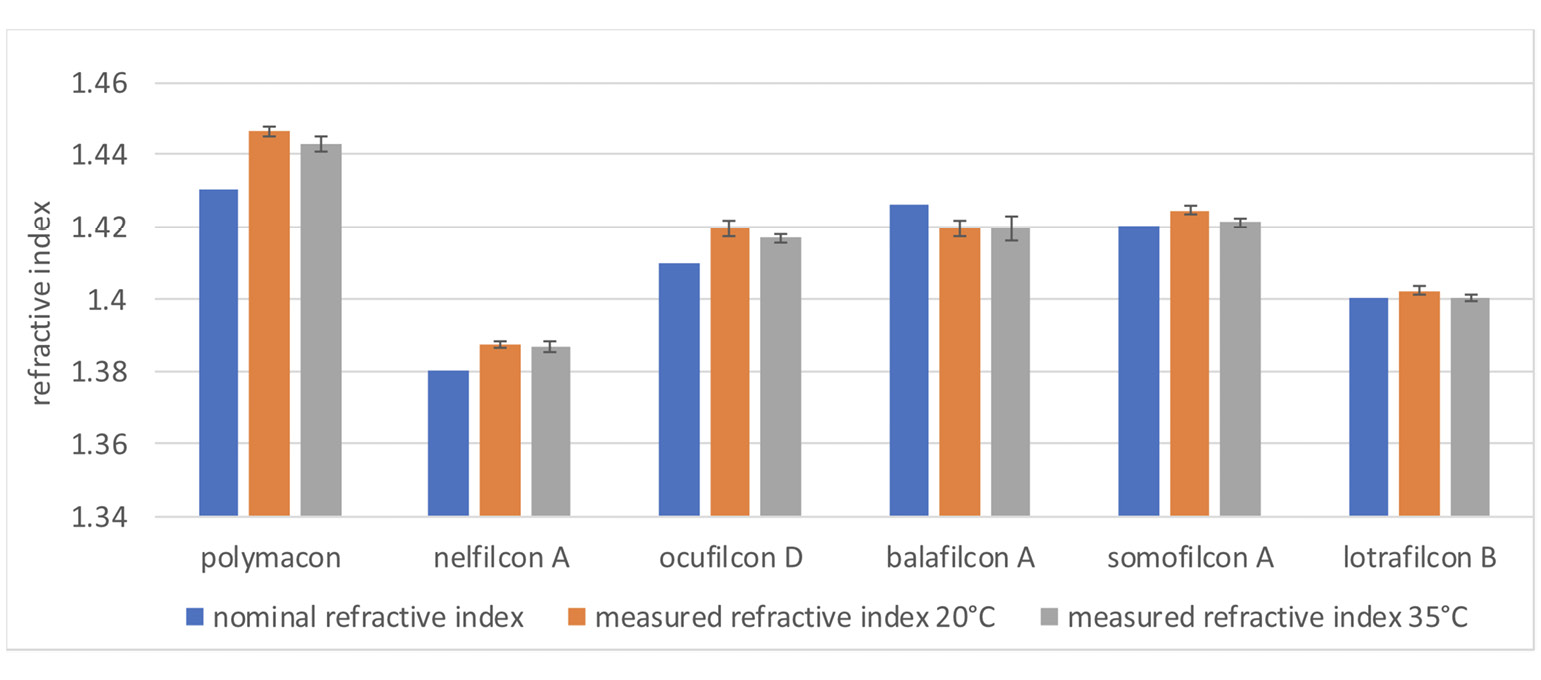
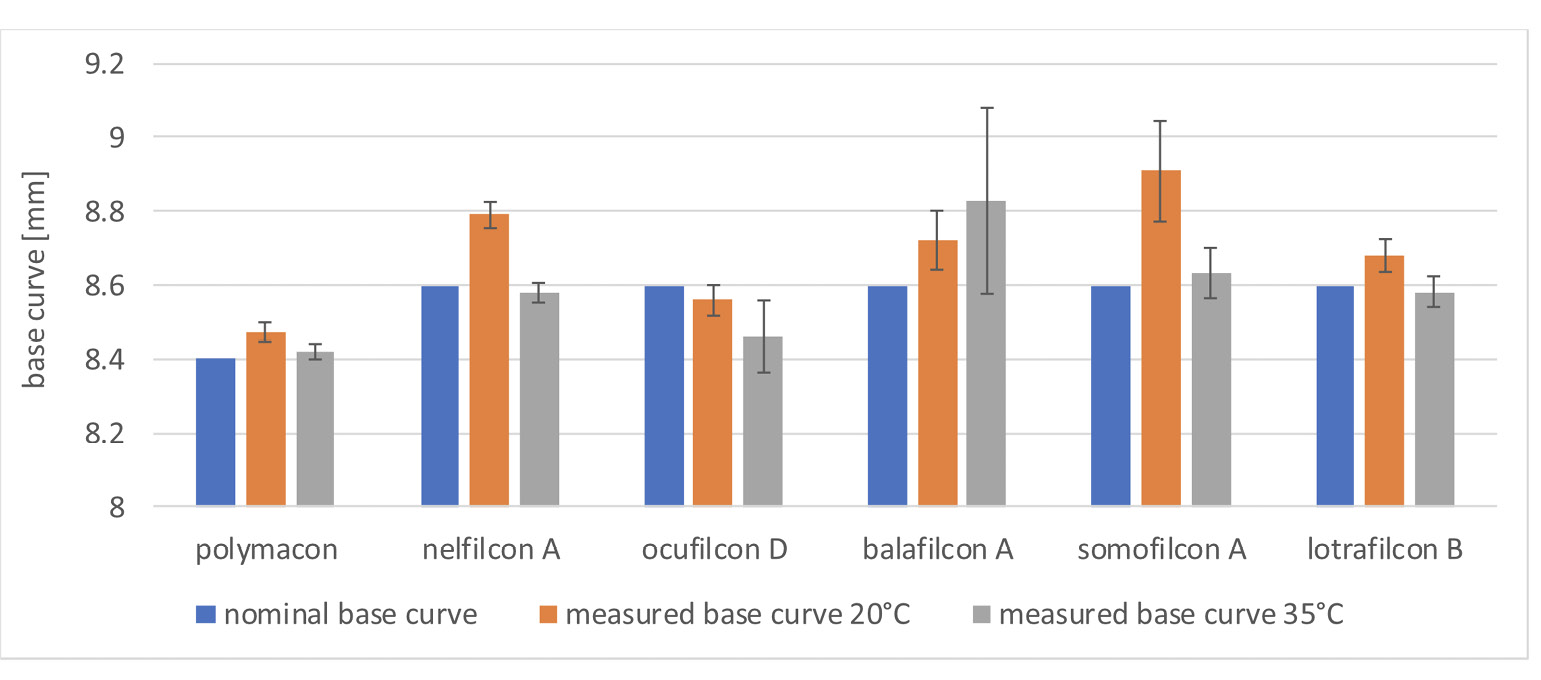
The results for the three parameters investigated are illustrated in Figures 4-6. The diagrams show the 20 °C, 35 °C measurements and the manufacturer‘s specifications.
Discussion
Previous in vitro studies indicate an important role of temperature in the dehydration of contact lenses. This dehydration manifests itself in a change of parameters due to a de-swelling of the material which makes the refractive index increase and the base curve steeper.9 As a result, the back vertex power becomes more negative.11 Other parameters have also been studied in this regard. A study conducted by Rosenplenter in 2023 explored the temperature-related change in the sagittal depth of custom soft contact lenses. The OCT (is830, OPTIMEC, UK), which was used to measure the base curve, was also used for this purpose. The measurements showed a reduction in the saggital depth with an increase in temperature,17 confirming Becker‘s measurements.18 A potential reason for the dehydration-related de-swelling of the material could be the behaviour of hydrogels at different temperatures, including silicone hydrogels. Most hydrogels have an upper critical solution temperature (LCST) related to water binding between 32 °C and 35 °C 19 and thus show an inverse behaviour to metals,19,20 whose solubility increases with rising temperature. The aggregate state changes from solid to liquid and the material expands. Translated to a contact lens, this means it would swell. Hydrogels consist of a three-dimensional network of hydrophilic (water-binding) and hydrophobic (water-repellent) polymers that are cross-linked.20 The hydrophilic portion can be further divided into free and bound water. The amount of free, diffusible water increases as the temperature rises. Consequently, the free water diffuses out of the material and the proportion of bound water in the hydrogel dominates.21 This means that the contact lens dehydrates and becomes stiffer. It is therefore reasonable to assume that an increase in the water content of a contact lens will lead to an increase in free water and dehydration as a result of its wear. However, it is not the water content that is decisive for the degree of dehydration, but the copolymers of the contact lens material. These determine the number of bound water molecules in the material and their binding strength.22 Therefore, studies show that silicone hydrogels dehydrate less due to their hydrophobic content and their parameters are more resistant to external influences.
The measurement results of the refractive index deviate from the expectations based on the literature. According to the literature, the refractive index should have increased with an increase in temperature,7,8 which in turn would have indicated a dehydration of the material. In the case of these measurement results, it should be noted that additional manual pressure had to be applied to the measurement chamber in order to take the measurement. Theoretically, this should have resulted in additional compression of the material and thus an increase in the refractive index. However, in this study we observed a decrease in the refractive index with an increase in temperature. The deviations of the measured values from the nominal refractive index were also observed in other studies.23 The material of the contact lenses could be the reason for the decrease of the refractive index. Studies show that the refractive index of optical plastics such as PMMA 24 or also of pHEMA hydrogels 25 is reduced with an increase in temperature.
Another factor that affects the refractive index is the water content. The refractive index of water decreases with increasing temperature.26 Therefore, it could be assumed that the decreasing refractive index of the contact lens is mainly due to the decreasing refractive index of the water content. However, this does not match the results obtained, as the contact lens with the least change is the one with the highest water content. Finally, predicting the temperature behaviour of lenses is very difficult as there are many factors involved. Nevertheless, the reduction in refractive index has been confirmed by studies on PMMA 24 and pHEMA.25 Accordingly, in this test method, dehydration is not the dominant process, as was the case with Fatt and Chaston,7 but the actual reaction of the material.
The measurement results of the base curve show that it becomes steeper with an increase in temperature. This correlation was also observed or mathematically calculated in other studies.9,10,27 Contrary to other studies, no difference was found between hydrogels and silicone hydrogels.10,13,14 The maximum determined base curve difference found between the two temperature points in this study was 0.2 mm. Even slightly larger differences could affect the movement behaviour. With regard to the novel high-precision measurement method for determining the base curve using OCT, the following limitations should be mentioned. The temperature-controlled measurement of the base curve requires the OCT to be connected to the temperature controller. The connection is made by a silicone inlet and outlet tube from the controller, which are connected to the wet cell. When the unit is switched on, there is a flow of immersion fluid into the wet cell. As a result, the contact lens studied moves from its centred position and the measurement is thus hampered. Therefore, the desired measurement temperature must be pre-set with empirically determined buffers. The buffer depends on the room temperature which, in this study, was 24 °C. When the set temperature is reached, the temperature controller is briefly switched off, the contact lens is centred and the measurements are taken. If the temperature is reduced from 35 °C to 20 °C, it is important to note that the built-in glass pane in the bottom of the wet cell will mist up due to condensation and the condensate must be removed with a lint-free cloth before the next measurement can be taken. Otherwise, the contact lenses will not be detected by the system. In the case of multiple measurements, it is also important to pay attention to the level of the immersion fluid, which affects the image position. If immersion fluid is lost from the wet cell, the image position will shift.
Regarding the back vertex power results, the measurement method must be thoroughly discussed. In contrast to the determination of the base curve and the refractive index, the back vertex power measurement could not be determined directly at the desired target temperatures. The temperature of the measuring device or the cuvette in which the lenses are placed during measurement was maintained at room temperature (24 °C) throughout data collection. Therefore, the back vertex power was determined from the previously established temperature-dependent data of the base curve and the refractive index. In order for the NIMO instrument to output a back vertex power value, the measurement diameter, the refractive index of the lens and the surrounding medium and the thickness and the base curve of the lens must be specified prior to the measurement. To determine the back vertex power difference between 20 °C and 35 °C, one measurement was made with the parameters determined at 20 °C and another with the parameters determined at 35 °C. The results reveal that the back vertex power becomes more negative with an increase in temperature, thus confirming the hypotheses made based on the literature. It should also be mentioned that the VARIREF C automatic refractometer, which was used to determine the refractive index at 20 °C and 35 °C, was used for the first time to measure soft contact lenses. The significance of the data must therefore be viewed critically due to the lack of comparative data.
The measurements showed statistically significant changes in the parameters with an increase in the operating temperature. The refractive index was reduced, the base curve became steeper and the back vertex power mathematically more negative. It was also found that the temperature-related changes were not consistent with previously published data. Previous studies show an increase of the refractive index,7,8 a steepening of the base curve 9,10 and a more negative back vertex power 11 with an increase in temperature. The differences between the literature and the newly determined measurement results in this study are attributed to the different test methods and tested contact-lens materials.
Conclusion
The materials showed a reduction of the refractive index and the base curve with an increase in temperature, whereas the back vertex power became more negative. The changes are within the tolerances specified in ISO 18369-2. Since no clinically relevant changes in values were observed when measuring at these two different temperatures, the current practice of measuring at room temperature can be maintained.
Conflict of interests
The authors declare that there is no conflict of interests regarding the methods and devices mentioned in the article.

About Sebastian Marx
Ph.D., M.Sc., Dipl.-Ing. (FH) - JenVis Research GbR, Jena, Germany, Ernst-Abbe-Hochschule Jena, University of Applied Sciences, Jena, Germany