Decoding Reading Difficulties: The Role of Eye Movements, Naming Speed, and Visual Processing in Literacy Development
Purpose. Specific reading difficulties affect approximately 3 – 9 % of school-aged children. Their assessment requires language-specific diagnostic tools. This study aimed to develop and validate reading skill tests in Latvian and to evaluate the interaction between phonological processing, naming speed, and age in reading performance.
Material and Methods. A total of 2,258 school-aged children participated, with 640 children (7 – 18 years) completing the full test battery. Reading speed (ORFT) was assessed alongside saccadic eye movements and rapid automatized naming (RAN) using the Developmental Eye Movement Test (DEM). Written language skills were evaluated through single-word identification (VWR) and non-word decoding (VND). Age-related criteria for impaired reading performance were determined using statistical outlier detection. Correlation and multiple regression analyses were conducted to identify predictors of ORFT.
Results. Approximately 10 % of participants exhibited reading difficulties. Reading speed was significantly correlated with all reading skill measures (r = 0.76 – 0.84, p < 0.05). Multifactorial regression analysis (R² = 0.77) revealed that ORFT could be predicted by VWR (a), VND, RAN (b), DEM (c), and age (95% CI):
ORFT = 0.06 • a + 1.26 • b + 2.84 • c – 0.0048 • J • (a • b • c) – 0.18
Lexical–semantic support enhanced word recognition efficiency by 27 % relative to non-word decoding. Developmental trajectories demonstrated rapid gains in reading fluency up to approximately age 12, followed by a plateau phase beginning in early adolescence.
Conclusion. The newly developed Latvian reading skill tests provide a reliable diagnostic framework for evaluating reading performance. Findings confirm the phonological theory of reading difficulty and highlight the combined influence of phonological processing, naming speed, and age on literacy development.
Introduction
Reading is a complex psycho-physiological and oculomotor process that integrates visual, linguistic, cognitive, and motor functions.1 Visual analysis of graphemes begins in the initial receptors responsible for orientation, spatial frequency, and contrast.2,3,4 Word recognition involves cross-referencing lexical represntations in long-term memory, while comprehension develops later, typically between ages 5 – 15, in parallel with increasing reading speed.5,6
Children with learning difficulties often show deficits in attention, perception, language, and motor coordination, which compromise reading.7,8 Dyslexia affects 5 – 10 % of the population,9,10 with boys more frequently affected.11 Theoretical models attribute these difficulties to phonological deficits,12 double-deficit hypotheses,13 and automaticity impairments,14 as well as neurobiological differences in cortical structures, cerebellar functions, and magnocellular pathways.15,17
Beyond phonology, visual and visuo-spatial factors significantly influence literacy. Dyslexic readers often exhibit impaired visual attention span, slowing grapheme processing independent of phonological ability.18,19 Recent work links dyslexia to visuo-spatial attentional deficits 20 and highlights multiple visual mechanisms rather than a single phonological cause.21 Similarly, near-point visual skills show small but significant effects on reading fluency,22 while uncorrected refractive errors and accommodative/binocular dysfunctions are more common among children with reading difficulties.23,24,40 These findings support comprehensive vision assessments in struggling readers.
At the same time, cognitive and environmental influences such as working memory, language development, and home literacy environment also play a role in shaping early literacy.25 Rapid automatized naming and pseudoword decoding remain key predictors of reading rate and accuracy.26,27 Yet, despite these advances, language-specific diagnostic frameworks remain limited – particularly in Latvian, where no standardized tools exist to assess the combined influence of phonological processing, naming speed, and visual-oculomotor functions on reading fluency. To address this gap, the present study develops Latvian reading skill assessments and establishes age-related performance norms, while examining how phonological, naming-speed, and visual processing factors contribute to reading fluency across childhood and adolescence.
Material and Methods
The experimental work was conducted as part of cross-sectional study of the ERAF project “Study of Vision and Visual Perception Disorders in School-Age Children and Development of Diagnostic Methodologies” at the Department of Optometry and Vision Science, University of Latvia (2011 – 2013). Approximately 11,000 students aged 6 – 19 years from 28 general education schools participated in the vision screening. The study protocol was approved by the Ethical Committee of the University of Latvia, and all procedures adhered to the Declaration of Helsinki. Testing was performed on-site at the schools with the informed, signed consent of the children’s parents.
Optometric assessments included evaluation of visual acuity, accommodation, vergence, binocular functions, and stereovision. The extended reading-skill assessment battery was developed to assess perceptual rate and capacity related to visual and written language processing. The Oral Reading Fluency Test (ORFT) was used as the reference measure against which other tasks (VWR, VND, RAN/DEM) were compared. This choice is aligned with established practice in reading assessment, where oral reading fluency is used as a benchmark,28 for evaluating decoding, accuracy, and automatization.
Data analysis was performed using Microsoft Excel, GraphPad Prism 5.0, and R. Descriptive statistics (mean, median, 10th percentile, quartiles) were used to establish normative criteria and cut-off values, while standard deviation and 1.5 times the standardized sample value were used to quantify dispersion.
Participants
A total of 11,000 students were screened, and a subset participated in the extended reading-skill assessment battery. Participants were selected through convenience sampling, based on school and student availability. When technically feasible, each child completed all reading-related tasks, and each task was performed only once (no repetitions). The following numbers represent the children whose data were usable for establishing task-specific age norms: oral reading fluency (ORFT) – 2,258 children; visual word recognition (VWR) – 1,932 children; visual non-word decoding (VND) – 1,031 children; and rapid automatized naming (DEM-V and DEM-H) – 1,167 children. For the multifactorial modelling of reading performance, only the subset of children (n=640) who completed all tasks was included. Participants were stratified into 12 age groups (7 – 18 years) and included 1,218 girls (54 %) and 1,040 boys (46 %), all were fluent Latvian speakers.
All children underwent a comprehensive visual function screening. Inclusion criteria required near visual acuity of ≥ 0.5 decimal (0.3 logMAR) and binocularity – stable fusion on the Stereotest TNO suppression test and the presence of gross stereopsis on a TNO test, ensuring that reduced visual acuity as uncorrected high refractive error or binocular dysfunction or neurological disorders do not influence performance. Children with corrected vision participated in their prescribed spectacles or contact lenses.
Stimuli
The components of vision and language printed form perception as the oral reading fluency task (ORFT) and the rapid automatized naming tasks (DEM-V and DEM-H) were evaluated with the use of stimuli at 40 cm in the printed text form.
The visual word recognition task (VWR) and the visual non-word decoding task (VND) where presented on computer screen at 50 cm. Rapid serial visual presentation served as a prototype for the computer software program. This technique, of using a computer screen to display stimuli as computer graphics, minimizes the effect of eye movements on cognitive load while reading. All the tasks were presented on the computer screen of a laptop computer with monitor parameters: HD WLED, resolution 1366 × 768 pt, at 60 Hz. Size of one pixel corresponds to 0.252 × 0.252 mm.2
Oral reading fluency passages task (ORFT) to assess reading speed
Oral/verbal reading involves all levels of cognition, in collaboration with the motor action of the muscles, including eye movements and articulation. Reading speed is highly dependent upon familiarity with the context of a text and a reader’s experience with the morphology and syntax of the text language. For the purposes of this study, reading speed was calculated as the number of words read per unit of time (words per minute), while graphemes per second was used to analyse the developmental trajectory of a process. All misreadings of words, including repetitions, omissions, insertions, and mispronunciations, were included in the reading speed calculation that was modelled after the Gray Oral Reading Test-III.39 The text was a fairytale that consisted of 130 words, 5 letters per word on average, or 1.5° in angular units. The contrast of the printed text was 99 %, letter size was 16 pt Times New Roman with 22 pt spacing between the rows. The text corresponds to a visual acuity of 0.25 in decimal units at 40 cm. One and the same text was used for all age groups, and it corresponded to a semi-easy readability text.29 The same text was used to allow the establishment of a developmental trajectory based on identical stimuli across ages; however, we acknowledge that this may introduce ceiling effects in older children. Before starting to read the text, each child was instructed as to two questions, to which they were asked to respond immediately after reading the text. This was done in order to insure that each child not only read, but also comprehended the text, rather than having read the text merely to complete the task as quickly as possible. Comprehension was not scored, but simply confirmed through discussion of the two questions.
Rapid automatized naming task (DEM (V) vertically and DEM (H) horizontally)
We used a prototype of Garzia et al. DEM (developmental eye movements) test in a task that was originally used to clinically assess motor quality of eye movement and rapid automatic naming skills. Coefficient of repeatability was r = 0.9, p < 0.001.30
The test consists of three charts of the size A5, upon which the numbers 1 through 9 are displayed. DEM(V) consists of charts A and B, each of which consists of 40 numbers that are placed in two columns (20 numbers in each column), whereas in chart C, 80 numbers are placed in 16 horizontal rows, 5 numbers in each row with variable spacing between them. Each number was 11 pt Calibri and corresponded to a visual acuity of 0.2 in decimal units at 40 cm. Vertical spacing between the rows of letters was 13 pt. The distance between the columns in charts A and B was 6.5 cm or 8 deg., where as in chart C, each row was 8.5 cm or 12 deg. long. There were five spacings between the numbers in chart C in DEM(H). There were overall 64 spacings between the numbers – 15 (23 %) in a size of 1.4 deg., 25 (39 %) in a size of 2.4 deg., 19 (30 %) in a size of 4.2 deg., 3 (5 %) in a size of 5.6 deg. and 2 (3 %) in a size of 6.7 deg.
Charts A and B were used to evaluate rapid automated naming (RAN), which is one of the components of phonetic perception.31 Chart C was used to evaluate eye movement efficiency when naming numbers by scanning them horizontally from left to right, like the way in which a reader scans text while reading. It has been proven that this type of test is clinically safe for evaluating saccadic eye movements in children.32
We measured the time required to complete the test, and we recorded the number of items that were either skipped or repeated. The result was calculated from the following formula: (Time × 80) / (80 − n + a), where time is in seconds, taken after completed task, n is the count of mispronounced numbers, and a is the count of repeated numbers.
Word recognition task (VWR)
The word recognition task is used to evaluate the ability to decode known, literary words in Latvian during one fixation without eye movements or articulation. We recorded the percentage of correctly decoded words. We presented 28 words of varying lengths (4; 6; 8; 10 graphemes) and of varying phonetic difficulty on a particular part of a computer screen for a limited amount of time (ms). Stimuli were viewable for different lengths of time for the different age groups of school-aged children-participants: 533 ms for grades 1 and 2; 267 ms for grades 3 and 4; 133 ms for grades 5 and 6; 100 ms for grades 7, 8, and 9; 67 ms for grades 10, 11, and 12. Letter size was 24 pt Baltic Sans that corresponds to a visual acuity of 0.18 in decimal units at a distance of 50 cm. The horizontal angular size at 50 cm corresponded to: 1.36 deg ± 0.03 for 4 letter words, 2.0 deg ± 0.1 for 6 letter words; 2.8 deg ± 0.1 for 8 letter words and 3.1 deg ± 0.1 for 10 letter words. Stimuli contrast was 99 % and the series of 28 words of varying lengths were presented at random.
Non-word decoding task (VND)
The non-word decoding task is created by forming an orthography that is phonetically legible (readable) but lacking in semantic content. This is done by altering a text, by replacing each letter in every syllable of every word with another.33 Non-word recognition is used to evaluate the ability to read an unknown word using visual field perception, as well as short-term and working memory.18 We recorded the percentage of correctly decoded non-words during one fixation without eye movements or articulation. We employed all the same equipment as was used in the word recognition task. Non-words were divided into 3 groups according to their lengths: 4, 5, or 6 letters. There were 7 non-words in each group, 21 overall. According to the program algorithm, the shortest non-words (those consisting of 4 letters) were presented first, followed by those consisting of 5 letters, and concluding with those non-words consisting of 6 letters. This order remained invariant. After each non-word was presented in the centre of a computer screen, each participant was asked to name the series of graphemes aloud. The length of time during which the non-word was viewable, and its font size were identical to the corresponding word recognition task parameters.
Results
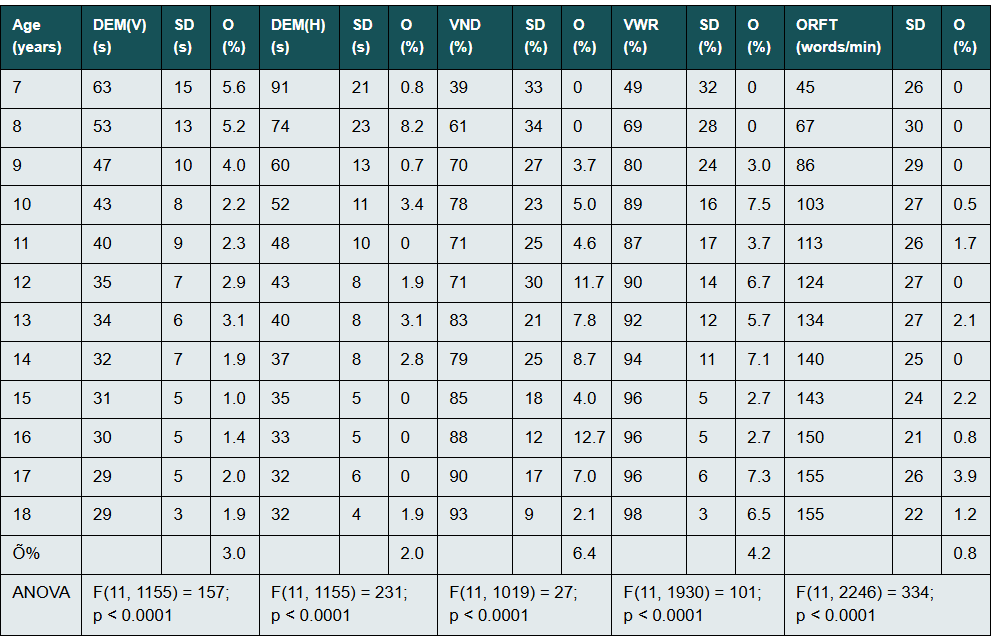
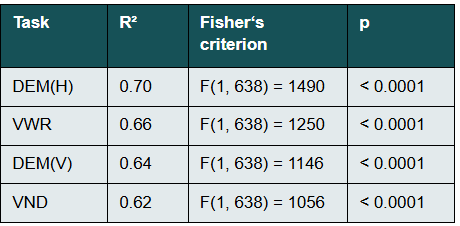
Table 1 presents descriptive statistics for oral reading fluency (ORFT), rapid automatized naming (vertical DEM(V) and horizontal DEM(H), word recognition (VWR), and non-word decoding (VND). DEM tasks (V, H) reflects to phonological awareness of graphemes (digits), visual perception, and articulation rate, while VWR and VND assess phonological awareness of graphemes (letters), morphemes, orthography, and visual perception. ORFT incorporates all parameters, including contextual effects. Outliers (O) were identified at each task – DEM(V), n = 35 (3 %), DEM(H), n = 23 (2 %), VND, n = 54 (6.4 %), VWR, n = 82 (4.2 %), ORFT, n = 19 (0.84 %) Of the 640 children who completed all five tests, 12.3 % (n = 79) were outliers in at least one task, indicating slower reading processing. One-way ANOVA revealed that age significantly affected variance for all measures. With increasing age all test scores improved significantly, with Fisher’s criterion exceeding the critical value in all cases.
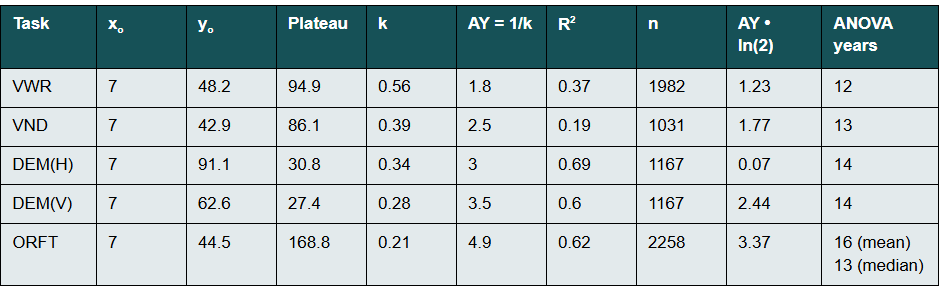
In Table 2 are shown developmental trajectories of each task modeled using nonlinear regression and ANOVA and Tukey’s post hoc test. They showed that differences between certain age groups ranged from significant to non-significant, reflecting reading process development. Results show that word recognition and non-word decoding reach developmental saturation first at second and thitd school year, suggesting that grapheme, morpheme, and orthographic processing precede fluency. In contrast, articulation, oculomotor activity, and perceptual processing stabilize later, around the third school year. Oral/verbal reading speed (ORFT) stabilizes around the fifth school year. It means that more demanding reading processes show later saturation due to greater cognitive and motor load.
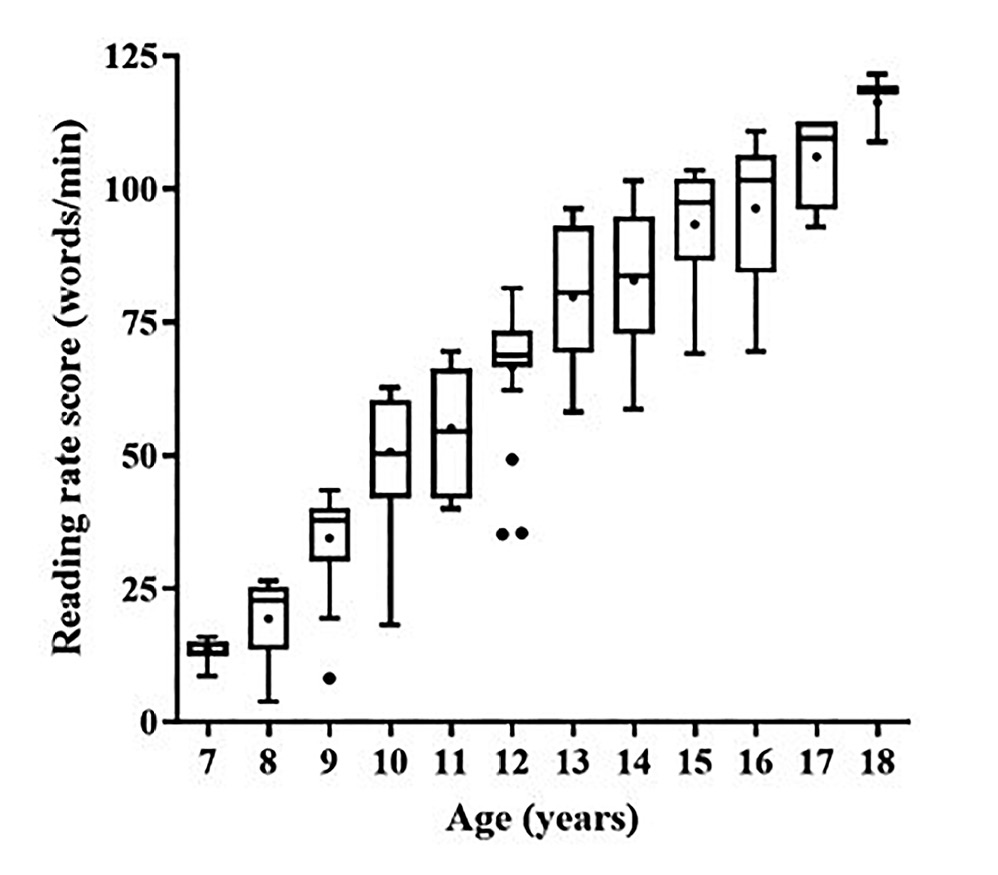
Among children identified as weak readers (n = 199; < 10th percentile), developmental trajectories remained delayed and did not fully mature by age 18 (F(1, 179) = 1.073, p < 0.0001). Their trajectory followed a positive linear slope, with an annual gain of approximately 9 words per minute, corresponding to a developmental delay of 3 – 6 years (Figure 1).
During each fixation, st rong readers processed graphemes, linguistic structure, and memory integration more efficiently, while inefficient eye movement control hindered linguistic processing.34 To isolate visual perception speed from age effects, all measures were converted to graphemes/second. Grapheme recognition rate increased with age, showing a strong correlation with age (r > 0.75) across all tests (Table 3). Thus, age was a robust predictor of grapheme perception speed in linear regression models.
Visual span (graphemes perceived per unit of time) increased significantly with age, surpassing the development of oculomotor and articulation-related processes. Visual perception requires integration of multiple cognitive processes and is constrained to allow efficient information processing. In rapid automatized naming, a significant difference emerged between vertical and horizontal saccade naming rates: F(1, 2330) = 11.12, p = 0.00087. Horizontal saccades, essential for reading, developed more rapidly than vertical saccades.
Grapheme perception speed was highest in orthographically similar non-word decoding and word recognition tasks, consistent with prior findings on visual information processing rates.35 The presence of semantic content increased processing capacity by 26.7 %. In oral reading, cognitive demands such as working memory, long-term memory, comprehension, syntax, lexical associations, articulation, and eye movements substantially reduced visual processing efficiency.
Multiple linear regression was used to examine the effects of word recognition, non-word decoding, and rapid automatized naming (vertical and horizontal) on oral reading speed. Data were derived from 640 children, expressed as graphemes per second. Correlations among predictors were high (r = 0.77 − 0.96).
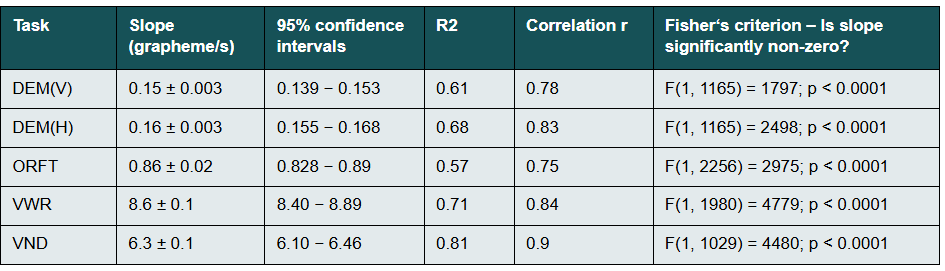
Single-factor regressions showed (Table 4) that oral reading speed (ORFT) was best predicted by horizontal rapid automatized naming, followed by word recognition, then vertical naming and last non-word decoding. In the four-factor regression model, all predictors except non-word decoding significantly influenced ORFT (p < 0.001). The model explained 77 % of variance (F(4, 635) = 536; p < 0.0001). The regression equation was:
ORFT = 0,06 • a + 1,26 • b + 2,84 • c − 0,0048 • J • (a • b • c) − 0,18
where ORFT = oral reading speed (graphemes/second), a = word recognition speed, b = DEM(V), c = DEM(H), J = adjustment coefficient (1s²/grapheme²).
Discussion
The present study yields several findings that converge with, extend, or diverge from prior research on visual–phonological processing, naming speed, oculomotor efficiency, and developmental trajectories of reading. Grapheme-perception speed showed a strong age-related increase (r > 0.75 across all tasks; Table 3, aligning with the documented expansion of perceptual span in earlier psychophysical and eye-movement research by Kwon et al.34 and Rayner.36 Although our methodology employed rapid serial visual presentation and single-fixation paradigms rather than whole-report or naturalistic eye-tracking techniques, the pattern of results indicates a broadly similar developmental trajectory. In addition, lexical–semantic facilitation improved recognition efficiency by 26.7 %, closely matching findings by Evans et al.37 showing that semantic context reliably accelerates word recognition in alphabetic orthographies.
Naming speed and oculomotor efficiency also emerged as major contributors to oral reading fluency. In particular, horizontal RAN/DEM was the strongest single predictor of ORFT performance (Table 4), consistent with Protopapas et al.38, who noted that serial naming gains predictive strength as children age. By contrasting vertical and horizontal DEM conditions, we were able to separate phonological-access speed from scanning efficiency, thus offering a more nuanced interpretation of the mechanisms involved. This aligns with earlier normative work by Garzia et al.30, which conceptualized horizontal DEM scores as indexing a combined load of eye-movement control and naming speed. In our sample, this combined measure accounted for substantially more variance in reading performance than tasks emphasizing primarily phonological decoding, such as VWR or VND.
The developmental trajectories observed for typical and struggling readers further reinforce existing theoretical models. ORFT performance tended to plateau around grade 5 in typical readers, whereas the weaker-reading group (n = 199) exhibited a delayed, non-saturating developmental curve extending to age 18 (Figure 1). This pattern is consistent with longitudinal findings from Vellutino et al.13, who reported that children with early deficits in phonology and naming speed show prolonged challenges in fluency even when accuracy improves. The linear progression among weaker readers also corresponds with Stanovich’s phonological-core variable-difference model,12 which proposes that insufficient automatization constrains long-term reading fluency.
Some results diverged from previous reports, particularly regarding pseudoword decoding and visual–perceptual mechanisms. Lobier et al.19 identified visual processing time as a substantial determinant of reading speed using tachistoscopic whole-report tasks. In contrast, our VND measure did not significantly predict ORFT in the multifactorial model. Differences in task design offer a likely explanation: our VND required overt decoding and articulation, adding phonological and motor components absent in the purely visual paradigms employed by Lobier et al. Moreover, in transparent orthographies such as Latvian, pseudoword decoding is highly consistent across individuals, potentially attenuating its predictive utility compared to less transparent orthographies like French.
Another inconsistency with earlier literature concerns the developmental course of oculomotor contributions to reading. Rayner 36 argued that eye-movement parameters stabilize relatively early, limiting their explanatory power once phonological factors are controlled. However, in our dataset, both DEM(H) and DEM(V) continued to develop throughout mid-childhood and contributed meaningfully to ORFT. These differences may stem from the much larger sample sizes in the present study (n = 2,258 for ORFT; n = 1,167 for DEM), which afford greater statistical sensitivity, and from the fact that DEM imposes greater articulatory and attentional demands than standard saccadic-tracking paradigms. Additionally, the morphologically rich structure of Latvian may necessitate more precise grapheme alignment and fixation planning, giving oculomotor variables a more sustained developmental role.
The interaction of phonological and visual-attentional processes also warrants consideration. Research by Franceschini et al.20 indicates that up to 40 % of struggling readers may exhibit primary visuospatial-attention deficits, and our results partially support this perspective given the strong predictive influence of horizontal saccade-based naming. However, unlike Kristjánsson and Sigurdardottir,21 who posited a dominant visual-attentional cause for reading difficulties, our findings do not point to a single prevailing visual deficit. Instead, the combined predictive contributions of phonological, oculomotor, and perceptual processes are more compatible with the multifactorial framework proposed by Wolf et al.26 in the double-deficit model.
Several methodological considerations are important when interpreting differences between our findings and prior work. Many earlier studies relied on relatively small samples (n = 30 – 20), whereas the present investigation involved samples as large as n = 2,258, providing more reliable developmental estimates. Age ranges in earlier research were typically narrow—for example, Kwon et al.34 examined children aged 8 – 13 –while our sample spanned ages 7 – 18, enabling us to model full developmental trajectories. The linguistic and geographic contexts also differ: most previous studies were conducted in the US, UK, France, Italy, Iceland, Greece, or Turkey, whereas ours represents one of the first large-scale analyses in a Baltic language with highly transparent orthography. Furthermore, the assessment of oculomotor processes varies substantially across studies; much of the earlier literature relied on infrared eye-tracking, whereas we used DEM, which measures eye-movement efficiency indirectly via timed naming performance. These methodological distinctions help to contextualize apparent inconsistencies across findings.
Taken together, the strong combined influence of VWR, RAN/DEM, and age on ORFT (R² = 0.77) supports phonological-core plus processing-speed models of reading development while also emphasizing the often underappreciated role of oculomotor efficiency. Clinically, the finding that 12.3 % of children failed at least one assessment underscores the need for comprehensive screening batteries that integrate phonological, naming-speed, and visual–oculomotor measures. Moreover, the continued development of visual span and RAN/DEM into early adolescence highlights the potential benefits of targeted interventions focusing on visual attention and oculomotor training, consistent with emerging evidence supporting their efficacy.
Conclusion
This study provides the first large-scale, language-specific norms for reading-related visual, phonological, and oculomotor processes in Latvian schoolchildren. Oral reading fluency was best predicted by a combination of word recognition, naming-speed, and horizontal saccade-based naming, with the multifactorial model explaining 77 % of variance. Developmental trajectories showed rapid improvement in early primary school and continued, though slower, gains through adolescence. Struggling readers demonstrated substantially delayed trajectories that persisted into late adolescence.
Although this work was conducted in Latvian, the underlying developmental principles-growth of visual span, automatisation of grapheme–phoneme conversion, and increasing efficiency of serial naming and saccadic scanning—are shared across alphabetic writing systems. Thus, the core findings are expected to generalise to children from other linguistic backgrounds, particularly those reading transparent orthographies. Differences may arise in languages with deeper orthographies, but the multifactorial interaction between phonological processing, naming-speed, and age is consistent with cross-linguistic evidence.
These results highlight the importance of comprehensive, multi-component assessments in identifying reading difficulties and provide a validated framework for early screening and educational support.
Diese Ergebnisse unterstreichen die Bedeutung umfassender, mehrkomponentiger Bewertungen für die Identifizierung von Leseschwierigkeiten und bieten einen validierten Rahmen für die Früherkennung und pädagogische Unterstützung.
Conflict of Interests
The author declares that there is no conflict of interests regarding the methods and devices mentioned in the article.
Acknowledgements
This work has been supported by the European Social Fund within the project «Support for Doctoral Studies at University of Latvia», Nr.2009/0138/1DP/1.1.2.1.2/09/IPIA/VIAA/004 and European Regional Development Fond (ERAF) project Nr. 2011/0004/2DP/2.1.1.1.0/10/APIA/VIAA/027
COE Multiple Choice Questionnaire
The publication "Decoding Reading Difficulties: The Role of Eye Movements, Naming Speed, and Visual Processing in Literacy Development" has been approved as a COE continuing education article by the German Quality Association for Optometric Services (GOL). The deadline to answer the questions is 1st February 2027 .Only one answer per question is correct. Successful completion requires answering four of the six questions.
You can take the continuing education exam while logged in.
Users who are not yet logged in can register for ocl-online free of charge here.
Morris R. (2002). The second deficit: An investigation of the independence of phonological and naming-speed deficits in developmental dyslexia. Reading and Writing, 15, 43–72.