Longitudinal Study on Myopia Progression Considering Axial Length and Refraction in Caucasian Students
Purpose: Students are a risk group for myopia progression because of their intensive levels of near work. This study aimed to evaluate the progression of myopia in Caucasian students over a period of two years.
Material and Methods: In a prospective multivariate longitudinal design over a period of two years, data from both eyes of 84 subjects (mean age = 23.7 ± 3.7 years; mean spherical equivalent = −2.01 ± 2.52 D) were randomized for statistical analysis. Axial length, non-cycloplegic refraction and corneal refractive power were measured using the Myopia Master (Oculus Optikgeräte GmbH, Germany). Additionally, data on near phoria, accommodation, outdoor activity, daily time with near work, and refractive influences were collected.
Results: The subjects showed a statistically significant increase in axial length from baseline mean 23.98 ± 1.19 mm by 0.067 ± 0.025 mm ( = 0.010). The objective spherical equivalent (baseline mean = −2.01 ± 2.52 D) showed no statistically significant shift towards myopia (p = 0.113). In the moderate myopic subgroup, 40.0 %, 50.0 %, and 10.0 % showed axial myopia and refractive myopia of the crystalline lens or cornea, respectively. The main reasons for myopia progression were an increase in axial length (51.3 %), a change in refractive power of the lens (41.0 %), and a change in refractive power of the cornea (7.7 %). Near phoria and progression of myopia were correlated (p = 0.033). All other parameters were within the normal range and did not show a correlation with the progression of myopia.
Conclusion: The risk group of Caucasian students showed neither a clinically relevant increase in axial length of the eye nor a change in objective spherical equivalent towards myopia over a period of two years. Nevertheless, the change in the refractive power of the crystalline lens is supposed to be an important factor for myopia progression, in addition to the change in axial length.
Introduction
Currently, myopia affects approximately 30 % of the world’s population.1 In the coming years, a worldwide increase in the number of myopes is expected for all age groups. Vision loss caused by high myopia with secondary pathological limitations, such as retinal detachment, cataract, glaucoma, or myopic maculopathy, considerably reduces the patient’s quality of life. Currently, Asian regions bear a major burden of myopia. For example, with an increase in myopia prevalence to 87.7 % among young Chinese adults between 17 and 19 years of age in 2015, this trend was considered a “serious public health problem”.2 In the coming decades, Europe is expected to be much more affected as well.1,3
The major part of the current research focuses on myopia in children. The earlier the onset of myopia, the higher the risk for high myopia (> −6,0 D) with a large axial length of the eye. Nevertheless, myopia can also start 5,6 and progress 7,8 into young adulthood after the age of 20 years. The reasons for late-onset or adult-onset myopia may be related to genetic, geographical, and environmental factors, as well as the time spent on near work,9,10 educational level, and less time engaged in outdoor activity.5,11,6 Especially in Western parts of the world, late onset is common.12 In Norway, 43.3 % of medical students showed late-onset myopia,13 while another scientific paper reported late-onset myopia in 47.8 % of Caucasian office workers.14 Even if the progression of adult-onset myopia is not as high as that in childhood, the individual consequences can be considerable.3 Therefore, myopia management should be offered to adults with the purpose of improving quality and efficiency in all parts of life.
Intensive near work over the years is thought to be the main cause of myopia progression after the age of 20 years.15 One study showed that university graduates have a higher percentage of myopes (53.0 %) than young people without a degree (34.8 %).16 Every additional year of education after school is connected with a mean myopia progression of −0.27 D.17 Furthermore, subjects with a high genetic risk for myopia showed increased progression of myopia through higher education.18 This shows that the risk for myopia arises from a combination of several factors, e.g. genetic and environmental conditions. One possible explanation for the subsequent progression of myopia associated with intensive near work might be the excessive innervation of the ciliary muscle and the decrease in radii of curvature of the crystalline lens, which leads to refractive myopia.4,19
Previous studies have shown that university students are at risk for myopia progression in young adults. Scientific papers on this topic are either several years old or have mainly focused on Asian regions. Therefore, this study aimed to evaluate the change in axial length of the eye, objective refraction, and other risk factors for myopia progression over a period of two years in Caucasian students in Germany. This study aimed to analyze if and for what reasons myopia progression occurred.
Material and Methods
A prospective multivariate longitudinal study was conducted to evaluate changes in axial length, non-cycloplegic objective refraction, near phoria, lag of accommodation, daily time with outdoor activity, and daily time with near work. Furthermore, the refractive influences of the cornea, crystalline lens, and axial length on myopia and progression of myopia were analyzed. Over a period of two years a baseline visit (BL) in 2019 and two annual follow up visits, FU1 in 2020 and FU2 in 2021, were performed in an exploratory manner. The study was approved by the ethics committee of Friedrich Schiller University in Jena, Germany, and the procedure followed the Declaration of Helsinki and principles of Good Clinical Practice.
Test persons
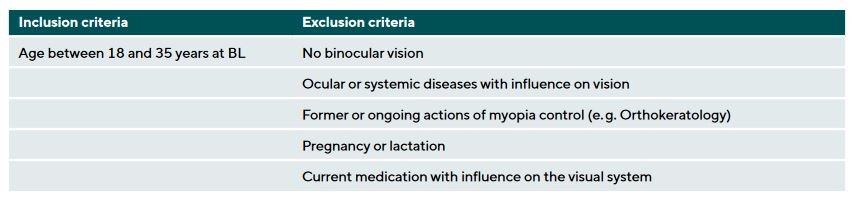
The study subjects were Caucasian students between 18 and 35 years of age from Jena, Germany. The inclusion and exclusion criteria are presented in Table 1. Due to the exploratory design, a formal sample size calculation was not necessary. At BL, 202 subjects participated in the study. At follow up, 76 (FU1) and 86 subjects (FU2) attended again. The high number of dropouts can be explained by the Covid-19 restrictions. Overall, 84 complete data sets of subjects who attended at least BL and FU2 were analyzed (mean age at BL 23.7 ± 3.7; 28 males, 56 females; mean ametropia at BL −2.01 ± 2.52 D). Six subjects were highly myopic (spherical equivalent (SE) ≤ −6.0 D), 52 were myopic (−6.0 D < SE ≤ −0.5 D), 15 were emmetropic (−0.5 D < SE ≤ +0.5 D), and 11 were hyperopic (SE > +0.5 D). Of the 84 complete datasets, 50 included all three visits. For the second part of the evaluation, the Gullstrand refraction analysis system (GRAS) data, two test persons had to be excluded because of technical issues (N = 82).
Study procedures
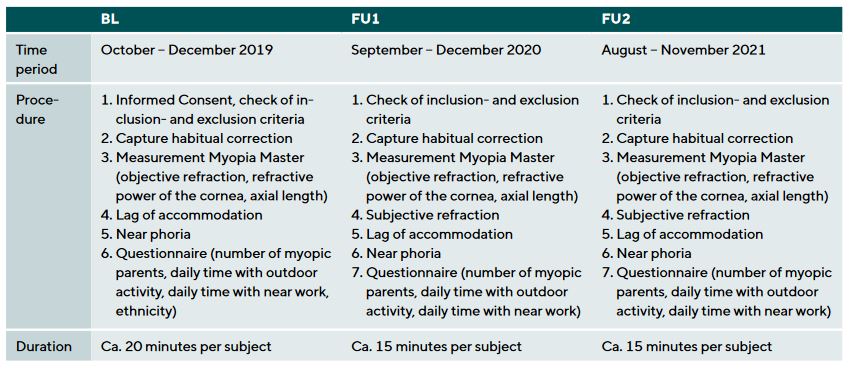
Table 2 provides an overview of the content of the visits. All examinations at every visit were conducted by the same investigator in the Department of Optometry at the Ernst-Abbe-University of Applied Sciences in Jena, Germany. The BL examination began with an explanation of the study and the signing of informed consent. At every visit, the inclusion and exclusion criteria were checked before habitual correction was captured. The first station was the Myopia Master (Oculus Optikgeräte GmbH, Germany), which measured the objective non-cycloplegic refraction, refractive power of the cornea, and axial length of both eyes. Compared to the IOL Master 700 and the Shin-Nippon NVision 5001 auto-refractor the device delivers an accurate axial length measurement and a moderate agreement in objective refraction.20 To prepare the following measurements, subjective refraction was performed using a Logarithmic Visual Acuity Chart (Precision Vision). Afterwards, the lag of accommodation was measured using the monocular estimate method retinoscopy. Furthermore, near phoria was detected using a Maddox cylinder and a Thorington card at a 0.4-meter distance. In conclusion, a questionnaire was used to obtain information about the number of myopic parents, daily time spent outdoors and on near work, and ethnicity. Outdoor activity was defined as the average time that a test person spent outdoors in the fresh air every day. On the other hand, time spent on near work includes all activities such as reading and using digital devices (smartphones, tablets, laptops, etc.). To ensure comparability, measurement setup and procedures were identical
at all visits.
Statistical analysis
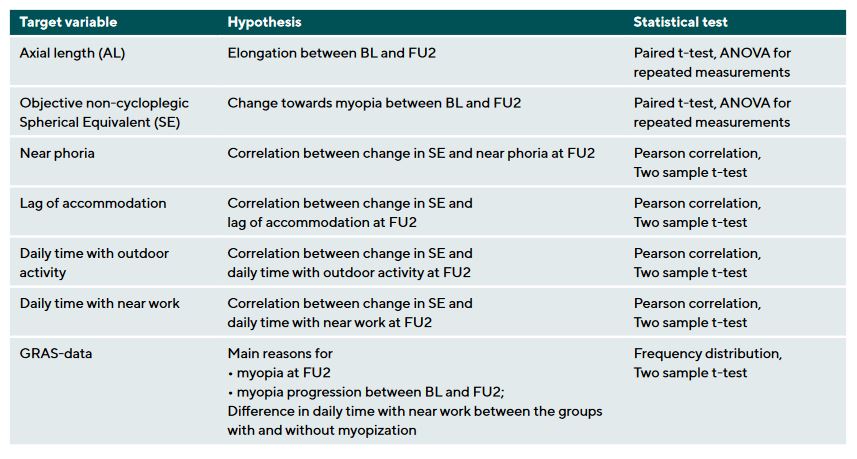
Statistical evaluation was performed using IBM SPSS Statistics (version 24). Data from both eyes were captured and randomized for analysis. Table 3 shows the primary and secondary endpoints along with the associated hypotheses and statistical tests. A significance level of 0.05 was adopted, and p-values less than this threshold were considered statistically significant. Normal distribution was confirmed using the Kolmogorov-Smirnov-Test.
The Myopia Master software evaluates the Gullstrand refraction analysis system (GRAS) data. By comparing the measured parameters and the normative Gullstrand data, it is possible to assess refractive influences of axial length, refractive power of the cornea, and crystalline lens in the total objective refraction. This enables the user to differentiate between axial and refractive myopia, which was defined in this study by the highest GRAS value according to the definition by the International Myopia Institute.21 Hybrid forms were not considered. Furthermore, the reasons for myopia progression were analyzed by calculating GRAS differences between BL and FU2. The highest negative value was decisive in assessing the main reason.
Results
Axial length
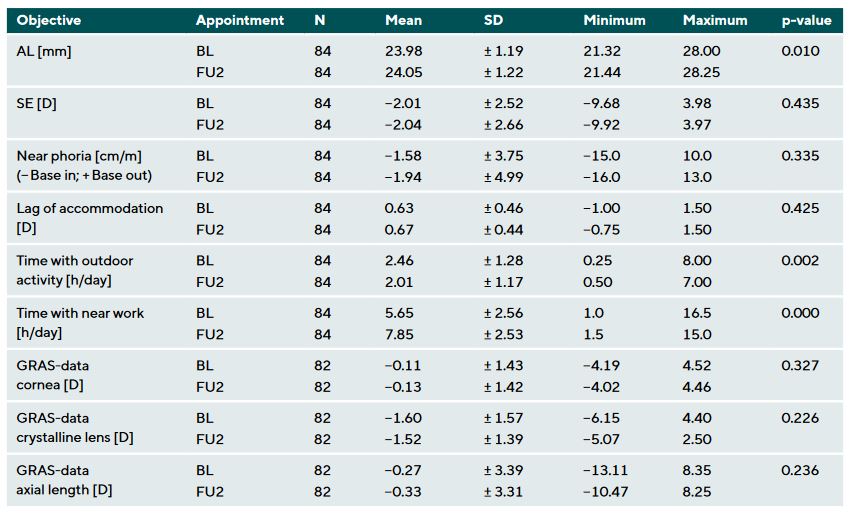
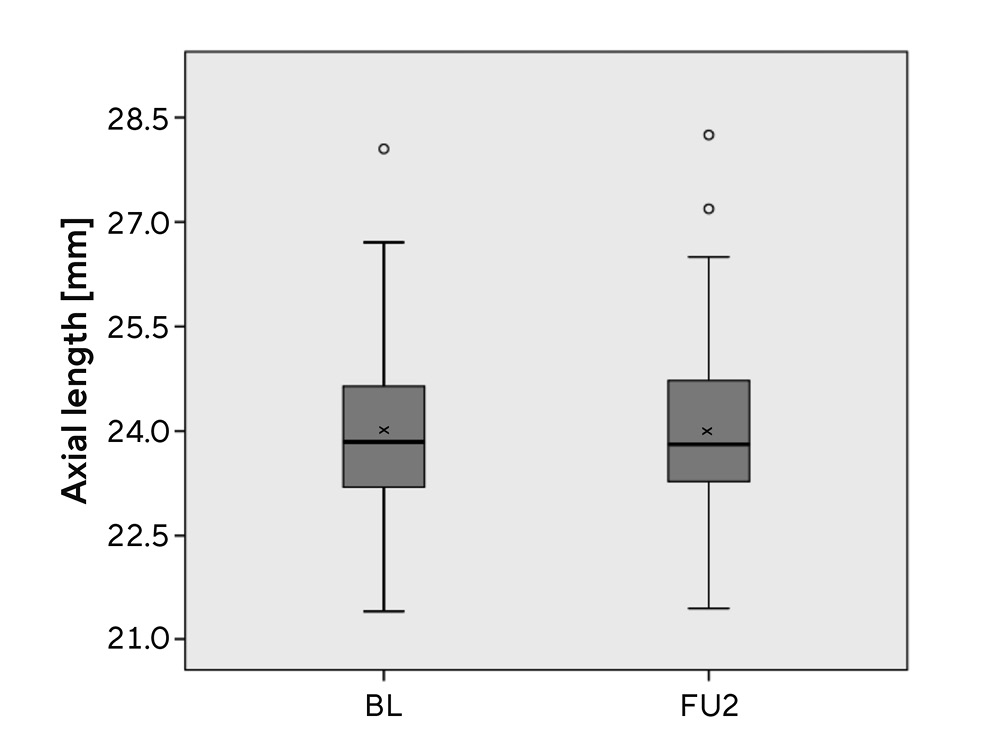
The mean axial length increased statistically significantly by 0.07 ± 0.03 mm (p = 0.010) between BL and FU2 (Table 4, Figure 1). In the data sets of test persons, who attended all three visits, the Repeated measures ANOVA indicated a
statistically significant difference between the visits (F = 13.232, p = 0.000, ηp2 = 0.134, N = 50). The main differences (Bonferroni post-hoc analysis) were between BL and FU1 (p = 0.003), BL and FU2 (p = 0.001) and FU1 and FU2 (p = 0.031).
Objective spherical equivalent
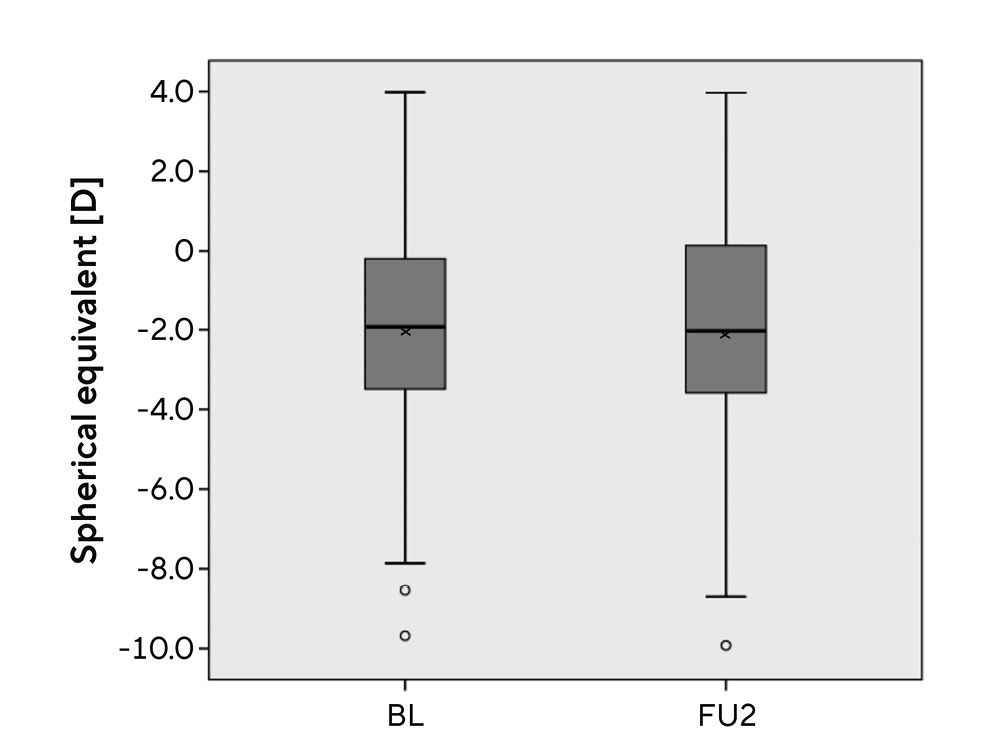
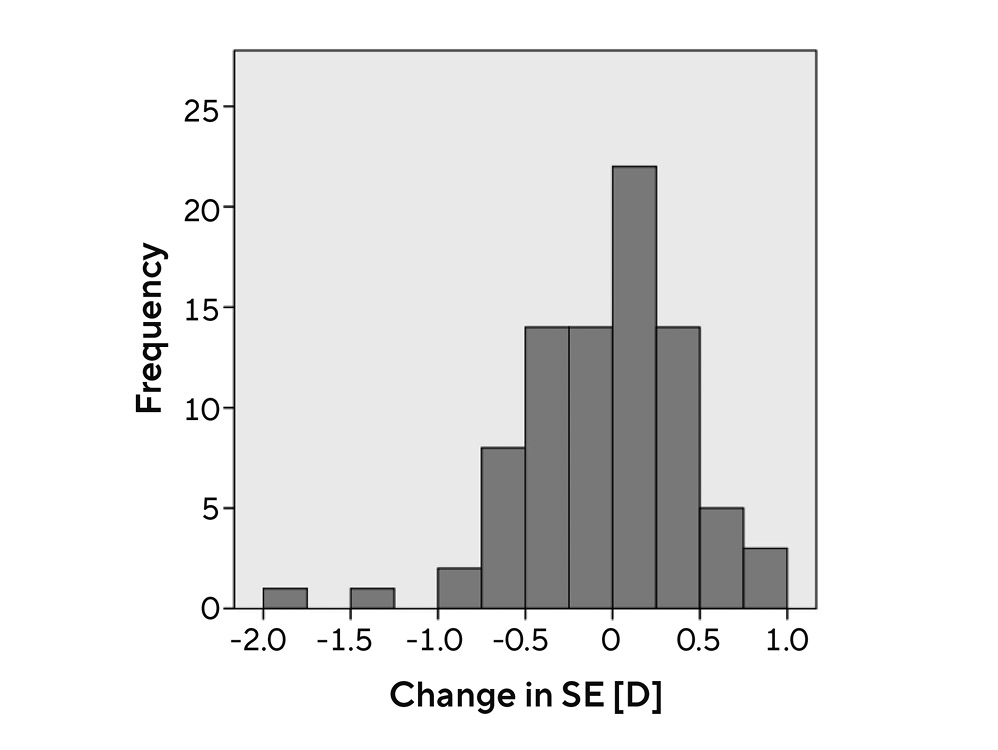
The mean spherical equivalent did not change significantly (p = 0.435) during the time period of two years (see Table 4, Figure 2). Nevertheless, 47.8 % of the eyes (N = 40) showed myopization (mean = −0.42 ± 0.36 D, minimum −0.01 D,
maximum −2.00 D; Figure 3). In the datasets of test persons who attended all three visits, Repeated measures ANOVA indicated no statistically significant differences between the visits (F = 0.726, p = 0.487, ηp2 = 0.015, N = 50).
Near phoria
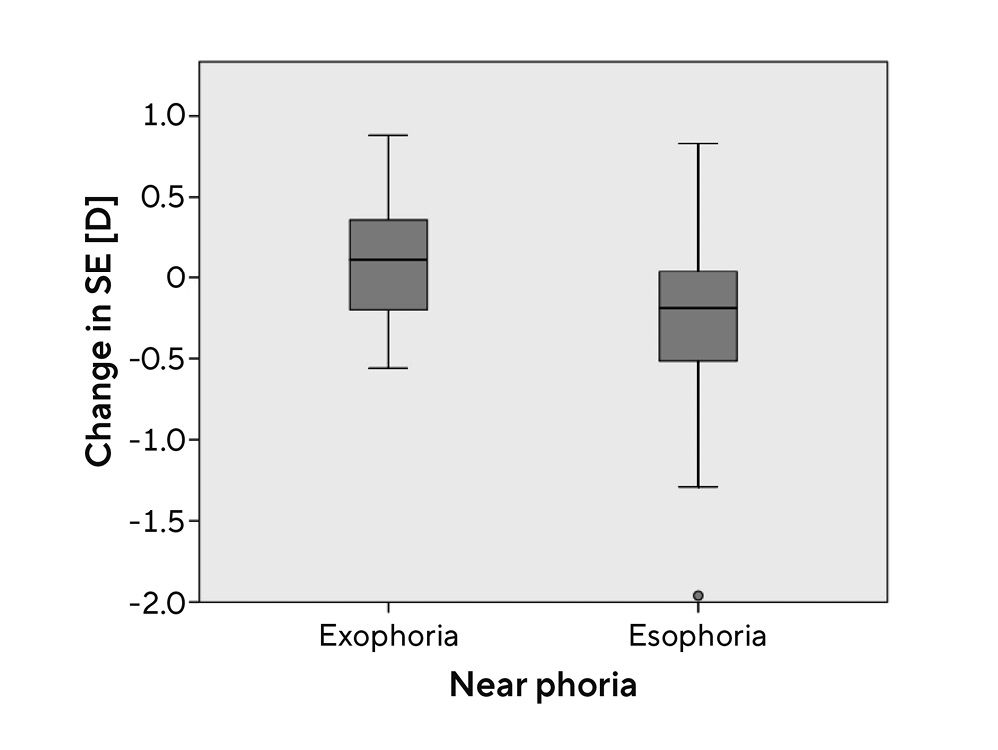
A correlation between near phoria and myopia progression was found (p = 0.033). The further analysis showed, that subjects with esophoria (≥ +0.5 Δ) had a statistically significant higher myopization than subjects with exophoria (≤ −0,5 Δ) (difference: mean SD = −0.33 ± 0.12 D; p = 0.006; Figure 4).
Lag of accommodation
The mean lag of accommodation did not show a correlation with myopization (p = 0.893). Furthermore, no statistically significant difference was found between the subject groups with and without myopization (p = 0.859).
Daily time with outdoor activity and near work
Neither daily time with outdoor activity (p = 0.791), nor
daily time with near work (p = 0.550) showed a statistically significant difference between the subject groups with and without myopization. Furthermore, neither objective was correlated with myopization (outdoor activity: p = 0.226, near work: p = 0.177).
GRAS-data
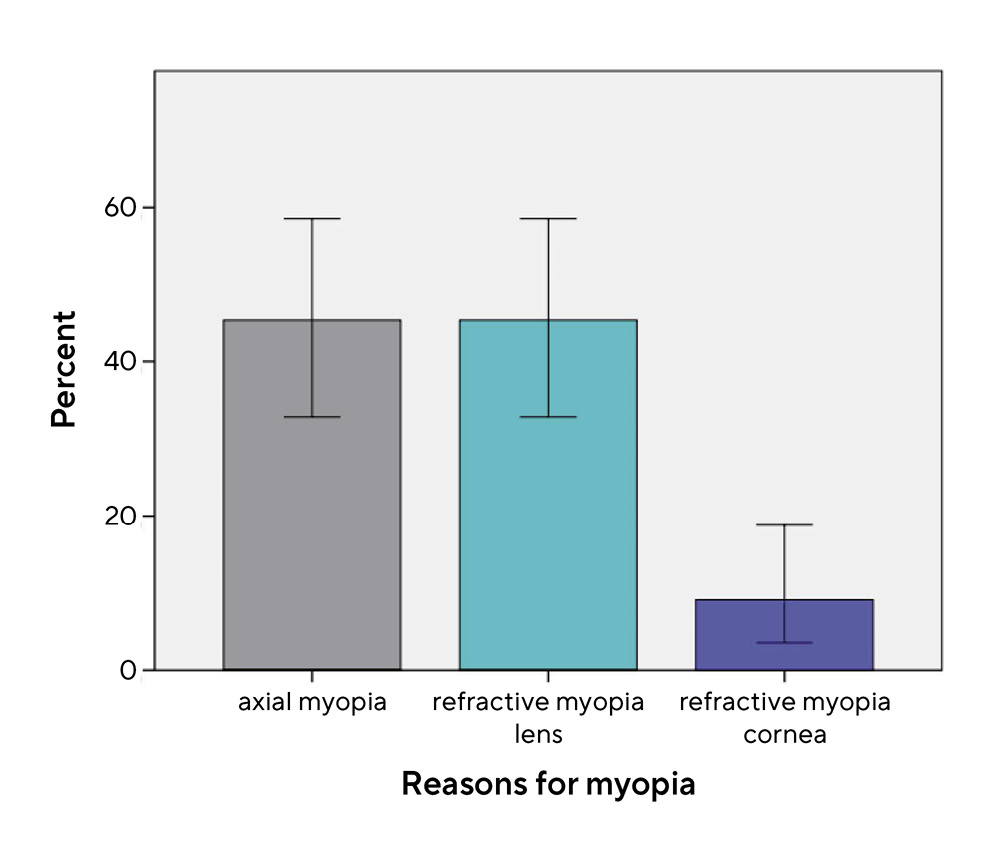
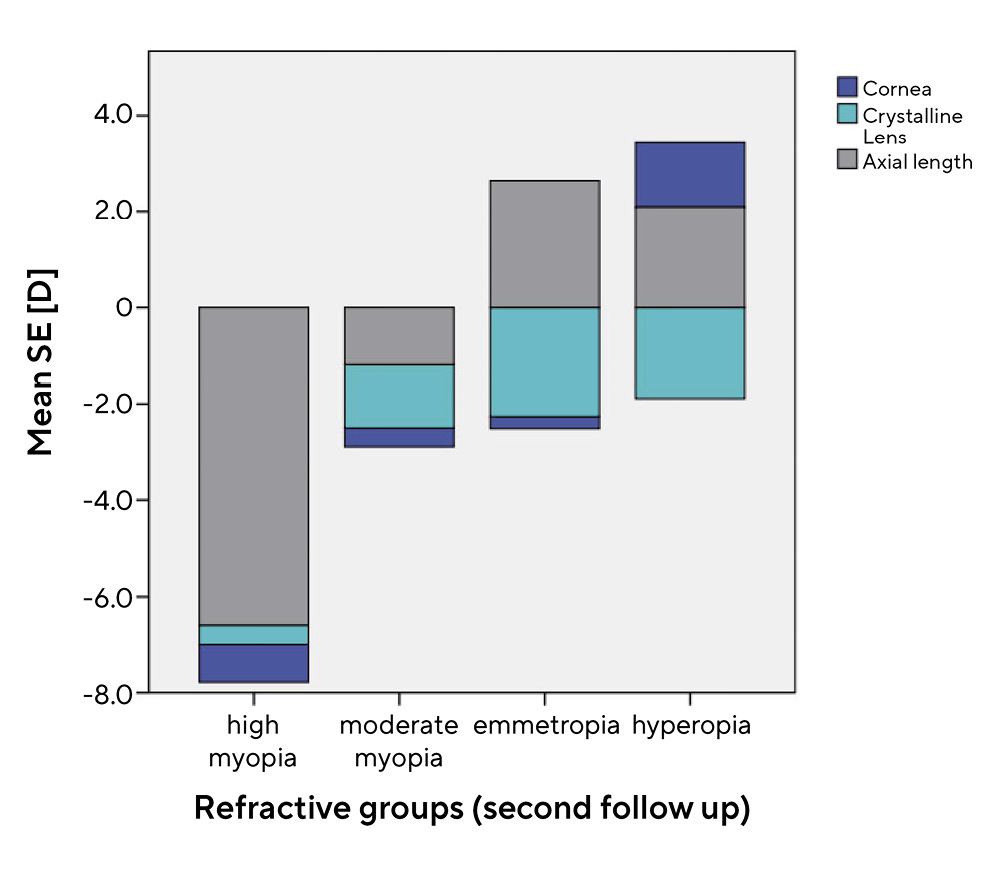
As seen in Table 4, the crystalline lens shows a value of −1.60 D at BL and −1.52 D at FU2, the highest negative value of the mean SE in comparison to cornea and axial length. A total of 58 subjects were myopic or highly myopic. Of those, in 45.5 %, 45.5 %, and 9.0 % axial length, refractive power of the lens, and refractive power of the cornea, respectively, were the main reasons for myopia (Figure 5). In the high myopic subgroup (N = 5), axial length was the main reason in 100.0 % of the cases (Figure 6). In the moderate myopic subgroup (N = 50), 40.0 %, 50.0 %, and 10.0 % showed axial myopia, refractive myopia concerning the lens, and refractive myopia concerning the cornea, respectively (Figure 6). In subjects with emmetropia or hyperopia, the refractive power of the lens influences the SE towards minus and is compensated by a positive refractive power caused by the axial length (Figure 6). In both cases, the refractive power of the cornea was a minor part of the mean SE. The main reasons for myopia progression were axial elongation of the eye, an increase in refractive power of the lens, and an increase in refractive power of the cornea by 51.3 %, 41.0 %, and 7.7 %, respectively (Figure 7). In addition, no statistically significant difference (p = 0.479) in daily time spent on near work was determined between the group with myopization due to a change in refractive power of the lens (mean = 6.3 ± 2.77 h/day) and the group with myopization due to axial elongation of the eye (mean = 5.5 ± 3.21 h/day). To determine the influence of near-work-induced transient myopia, no statistically significant difference in myopization between morning and afternoon appointments was found (p = 0.647).
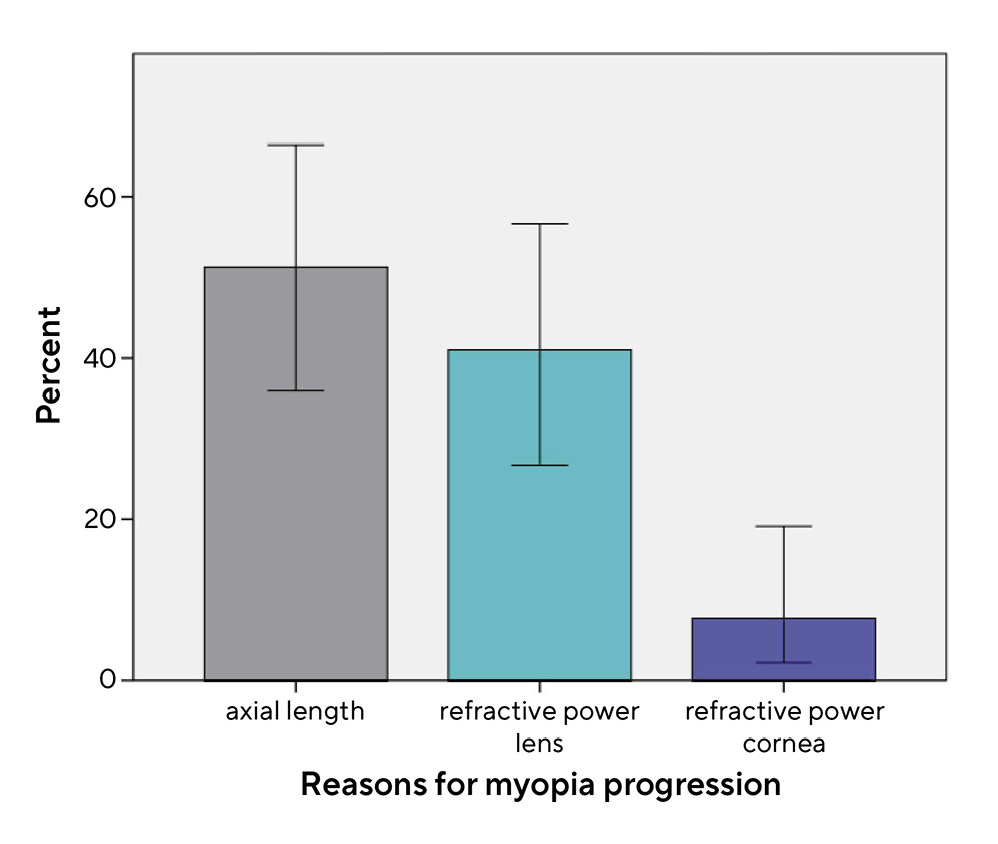
The main reasons for myopia progression were axial elongation of the eye, an increase in refractive power of the lens, and an increase in refractive power of the cornea by 51.3 %, 41.0 %, and 7.7 %, respectively (Figure 7). In addition, no statistically significant difference (p = 0.479) in daily time spent on near work was determined between the group with myopization due to a change in refractive power of the lens (mean = 6.3 ± 2.77 h/day) and the group with myopization due to axial elongation of the eye (mean = 5.5 ± 3.21 h/day). To determine the influence of near-work-induced transient myopia, no statistically significant difference in myopization between morning and afternoon appointments was found (p = 0.647).
Discussion
Study design and methods
The study has several limitations. The test population was a homogeneous group of students with a high number of myopes (68.3 %) due to their special interest in the topic. Therefore, it is not possible to transfer the results to the total population of young adults aged 18–35 years. In addition, the dropout rate was high. In 2020, FU1 had to be stopped in November due to the Covid-19 lockdown. One year later, FU2 underlay strict hygiene regulations, and many subjects decided against participation. The results may be different for a higher number of subjects. Furthermore, the follow-up period of two years might be too short to detect any differences in the progression of myopia. Therefore, a continuation of this study was planned. In this study, non-cycloplegic refractive measurements were conducted. According to Sanfilippo et al., in adults over 20 years of age, the differences in objective refraction with and without cycloplegia are small and not practically relevant.22 Nevertheless, missing cycloplegia might affect the repeatability of objective refraction measurement with the Myopia Master negatively. Furthermore, it was not possible to ensure that all study participants were examined in the morning without any near work before the appointment. No statistically significant difference in myopization between morning and afternoon appointments was found. Therefore, the falsification of the results can be excluded.
Axial length
The mean axial length data (BL mean = 23.98 ± 1.19 mm, FU2 mean = 24.05 ± 1.22 mm) are age-appropriate and do not differ from the Gullstrand value of 24.0 mm. The small statistically significant increase in axial length (mean = 0.07 ± 0.03 mm) during the two years equates to ca. 0.035 mm / −0.08 D refraction change per year. However, this result is not clinically relevant. Concerning datasets with three visits, statistically significant differences were found between all of them. An even increase in axial length over time can be assumed. A comparative study from Australia described similar results of 0.02 mm axial elongation of the eye per year in 20-28-year-old adults.23 Chinese studies 24; 25 have shown slightly higher annual axial elongations (0.06 mm) in young adults, which can be traced back to ethical and environmental factors.
Objective spherical equivalent
The mean spherical equivalent of −2.01 ± 2.52 D at BL can be explained by a high number of myopes with special interest in participating in the study. The mean SE did not show a significant change towards minus. Although, single cases of myopization up to −2.0 D over two years were detected, there were also cases of hyperopization (see Figure 3). Comparative studies have shown changes in SE in similar age groups. A Norwegian study described a change of −0.51 (0.49) D over three years (ca. −0.17 D per year),15 while Chinese results show values of −0.38 D over two years (ca. −0.19 D per year).24 The reasons for the different results compared to the current study might be ethic and environmental factors. A German retrospective study, that analyzed a collection of data from dispensing opticians, reported no significant change in refraction towards myopia in people between 5 and 30 years of age between 2000 and 2015.26 That confirms the results presented here.
Near phoria
The mean near exophoria had a value of 1.58 ± 3.75 Δ at BL (physiological range: 3 ± 3 Δ 27). No statistically significant difference between BL and FU2 was found (Table 4), but subjects with esophoria showed a statistically significantly higher myopization than subjects with exophoria (difference: mean = −0.33 ± 0.12 D). This indicates that near esophoria might be a consequence of myopia.28
Lag of accommodation
The mean lag of accommodation (BL mean = +0.63 ± 0.46 D) is in the physiological normal range of +0.50 ± 0.25 D 27 and did not change significantly between BL and FU2 (Table 4). No statistically significant difference was found between subjects with and without myopization. The current results confirm those of previous scientific studies. In both children and young adults, no significant correlation was found between the lag of accommodation and myopia progression.29–31 The accommodation parameters do not benefit the prediction of myopia or its progression.32
Daily time with outdoor activity and near work
Daily time spent on outdoor activity decreased by 0.45 h statistically significantly between BL and FU2 (p = 0.002). On the other hand, daily time spent on near work increased by 2.2 h (p = 0.000). This trend can be traced back to the Covid-19 pandemic, which demonstrably reduced time outdoors 33 and increased near work and digital media use in students because of online lecturing. No statistically significant difference was found between subjects with and without myopization for either parameter. Furthermore, there was no correlation with myopization. In the literature, the positive influence of daily time spent outdoors on progression as well as on onset of myopia in children is discussed controversial.34 In adulthood the protective influence is presumed to last.23 In contrast to the current study results, a Norwegian scientific study described a statistically significant correlation between time spent on near work and myopia progression in students.15 Nevertheless, recent studies reported, that the positive influence on already myopic eyes is not clinically significant,35 which can be confirmed by the current work. Further examinations over a longer period for both parameters are necessary for clarification.
GRAS-data
The mean refractive power of the crystalline lens shows the highest deviation from Gullstrand data towards minus in comparison to the cornea and axial length (Table 4). Furthermore, in 45.5 % of the myopic eyes this is the main reason for myopia, which underlines the importance of the lens in assessing myopia in young adults. In the high myopic subgroup, axial length was the main cause of myopia in all eyes. Presumably, these high myopias occurred because of genetic reasons and had an early onset. On the other hand, 50.0 % of the eyes in the current study had refractive myopia induced by the cristalline lens (Figure 6). These could be late-onset myopias, which might be affected by several environmental factors such as intensive near work. To proof or decline this correlation further studies are necessary. A limiting factor in this contemplation is the difference in sample size between the high myopia (N = 5) and moderate myopia (N = 50) groups. With a sample size of five, the results can only be considered an assumption.
Previous prospective studies in adults showed that axial elongation of the eye is one of the main reasons for myopia progression,36 as observed in this study (51.3 %). Nevertheless, research considers that a change in the refractive power of the lens can contribute to the progression of myopia in special risk groups.37,19 This fact was also confirmed by the results of the current study (41.0 %). However, the small sample size of 39 allows for assumptions only, which must be reviewed in subsequent studies over a longer time period with higher subject numbers. Even if excessive near work is supposed to be a reason for late-onset myopia, our results showed no significant differences in myopization between the groups with axial or refractive myopia progression. Nevertheless, it is important to note that both axial and refractive progression can affect young adults. Knowledge of the reasons for myopia progression is the basis for myopia management in all age groups.
Conclusion
This study investigated myopia progression among Caucasian students in Germany. It relied on measurements of axial length and spherical equivalent refractive error over a period of two years. Among the study cohort neither a clinically relevant elongation in axial length nor a change in spherical equivalent was found. Nevertheless, there were cases of myopia progression. In these cases, the refractive power of the lens was the main reason for myopia and its progression. This should be considered in myopia management for individual cases.
Conflict of interest
The primary author has nothing to disclose. The other authors Stephan Degle and Philipp Hessler serve as consultants to OCULUS Optikgeräte GmbH. However, they received no funding nor have no financial interest in this original research.

About Katharina Keller
M.Sc. - Ernst-Abbe-Hochschule Jena, University of Applied Sciences, Jena, Germany, JenVis Research GbR, Jena, Germany
Klaver, C. C. W., Logan, N. S., Naidoo, K., Resnikoff, S., Sankaridurg, P., Smith, E. L. 3rd., Troilo, D., Wildsoet, C. F. (2019). IMI - Myopia Control Reports Overview and Introduction. Invest Ophthalmol. Vis. Sci., 60, M1-M19.