Validation of selected tablet apps for determining visual acuity
Purpose. The aim of the study is to investigate whether applications for mobile devices are suitable for the professional determination of visual acuity.
Material and Methods. The best-corrected logMAR was determined in 25 healthy subjects (age: 25.7 ± 6.7; Vcc ≥ 1.0) using the Konan Acuity and the Snellen chart applications with letters (B) and with Landolt rings at 4 orientations (L) both without an additional lens (0) and with additional spherical lenses +0.50 D (0.5) or +1.00 D (1.0), and compared with the logMAR determined on the corresponding ETDRS charts. Furthermore, the best-corrected logMAR was investigated for 6 of the 25 participants on the tablet at three different screen brightnesses (80, 200 and 370 cd/m²).
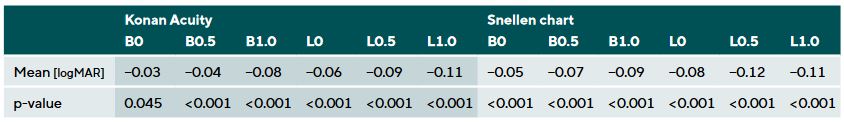
Results. For the Konan Acuity app, the following mean values and significant logMAR differences to the ETDRS charts were determined: B0: −0.20; ∆ = −0.03 (p = 0.045); B0.5: −0.13; ∆ = −0.04; (p < 0.001); B1.0: 0.06; ∆ = −0.08 (p < 0.001); L0: −0.20; ∆ = −0.06 (p < 0.001); L0.5: −0,13; ∆ = −0.09 (p < 0.001); L1.0: 0.08; ∆ = −0.11 (p < 0.001). For the Snellen chart app, the following mean values and significant logMAR differences to the ETDRS charts were determined: B0: −0.22; ∆ = −0.05 (p < 0.001); B0.5: −0.16; ∆ = −0.07 (p < 0.001); B1.0: 0.05; ∆ = −0.09 (p < 0.001); L0: −0.23; ∆ = −0.08 (p < 0.001); L0.5: −0.17; ∆ = −0.12 (p < 0.001); L1.0: 0.08; ∆ = −0.11 (p < 0.001). The median logMAR differences between the different screen brightnesses were 0.02 (80 – 200 cd/m²) and 0.00 (370 – 200 cd/m²).
Conclusion. At ideal screen brightness, both applications show significant differences to the ETDRS charts. However, these can be regarded as tolerable in clinical practice, at least in young, healthy eyes. The measurements with deviating screen brightness show only minor differences. With the right app, tablets are suitable for determining visual acuity in everyday clinical practice, but are unsuitable for scientific or expert purposes.
Introduction
Determining visual acuity is one of the most important procedures in the assessment of vision. It is based on presenting subjects with optotypes whose size, appearance, distance, sequence, contrast and form vary. While classic visual test charts have been validated and standardised over a long period of development, new digital versions have emerged in recent years. A priori, valid measurement results can only be expected from these digital alternatives if the measurement conditions correspond to the current standards for determining visual acuity or at least to a visual acuity chart that has been validated by scientific studies.
The current DIN EN ISO 8596 defines the Landolt ring with eight directions of presentation as the standard optotype, which should be presented in logarithmic visual acuity levels and, starting from visual acuity level 0.25, in at least five of eight different orientations per visual acuity level. The test distance must be at least 4 metres and the gaps between the Landolt rings have defined minimum distances depending on the visual acuity level.1 For clinical purposes letters, numbers and the Landolt ring with four directions of presentation are allowed, whereby the equivalence of the letters and numbers to the standard optotypes must be proven by a direct comparative test as described in ISO/TR 19498. Such comparative tests have shown, for example, that only some of the 26 letters of the Latin alphabet are suitable for determining visual acuity, provided they have been constructed in a certain size and aspect ratio.2
DIN EN ISO 10938, published in 2017, describes the presentation of optotypes in printed, projected and electronic form. According to this standard, optotypes must have contours which appear sharp to an observer with binocular visual acuity of 1.0 and 1.25 from a distance of one third of the intended test distance. For electronic displays, the pixel size must not exceed 0.25 arcminutes and, if image smoothing methods are used, the change in size of the optotypes must not exceed 5 %. The luminance of the optotypes may not exceed 15 % of the luminance of the test field, whereby the test field must have a luminance between 80 and 320 cd/m2 (recommended: 200 cd/m2) which may not vary by more than 50 % over the entire test field.3
For scientific purposes, visual acuity is usually specified as logMAR acuity, in part because the visual acuity value consistently changes by 0.1 per visual acuity level. If each row of the test chart contains the same number of optotypes, individual visual acuity values (e. g., 0.02 per optotype with 5 optotypes per row) can be assigned to individual optotypes and the measurement can thus be refined. In addition, with visual acuity values specified as logMAR, various calculation operations, such as averaging, are simpler than for decimal or Snellen acuity values.4 Accordingly, all visual acuity values in this study are given in logMAR.
There are numerous applications for determining visual acuity available in the app stores for mobile devices. The enormous differences in the design and quality of these applications are striking. The most common optotypes used in these applications are the Landolt rings, the Snellen E and capital letters. The optotypes are offered in wedge-shaped or uniformly arranged rows or individually. Some applications also deviate significantly from the standardised visual acuity test charts in terms of their image quality or test procedure. For example, in some apps, the measured value is determined using a scale of values (e.g., „peak acuity“), selection procedures (e.g., „vision check app“) with predefined answer options or simply „yes“ or „no“ queries. The result is usually displayed in Snellen, decimal or logMAR visual acuity, more rarely as a score for the number of correctly named optotypes. Many apps can be used at different test distances and point out that the results are for guidance only and do not replace a visit to an ophthalmologist or optometrist. One advantage of many applications for determining visual acuity is the possibility to display optotypes in random order. In this way, a memory effect can be avoided if the visual acuity is to be determined several times or on both eyes in succession, and thus a more reliable measured value can be expected.
Previous studies5–7 have found both a good correlation with standardised test charts and significant differences and problems in usability, such as reflections on the display due to room lighting.
The aim of this study is to test two selected apps for their suitability for the clinical use by optometrists or ophthalmologists, for example for mobile use. To this end, the visual acuity values determined with these applications are compared with the visual acuity values determined on standardised vision charts and the influence of screen brightness on the measurement result is examined.
Material and methods
A total of 25 test subjects (18 f; 7 m) aged 25.72 (± 6.7) years with a best-corrected visual acuity on the ETDRS chart of at least 1.0 (decimal) (M −0.17 logMAR ± 0.08 logMAR) took part in this study. Subjects exhibiting ocular pathology or taking medication that could lead to a reduction in visual acuity were excluded.
The measurements were conducted in accordance with the revised Declaration of Helsinki, the ethics and data
protection regulations of the Berlin University of Applied Sciences and the relevant legal provisions. A declaration of consent was obtained from all test subjects.
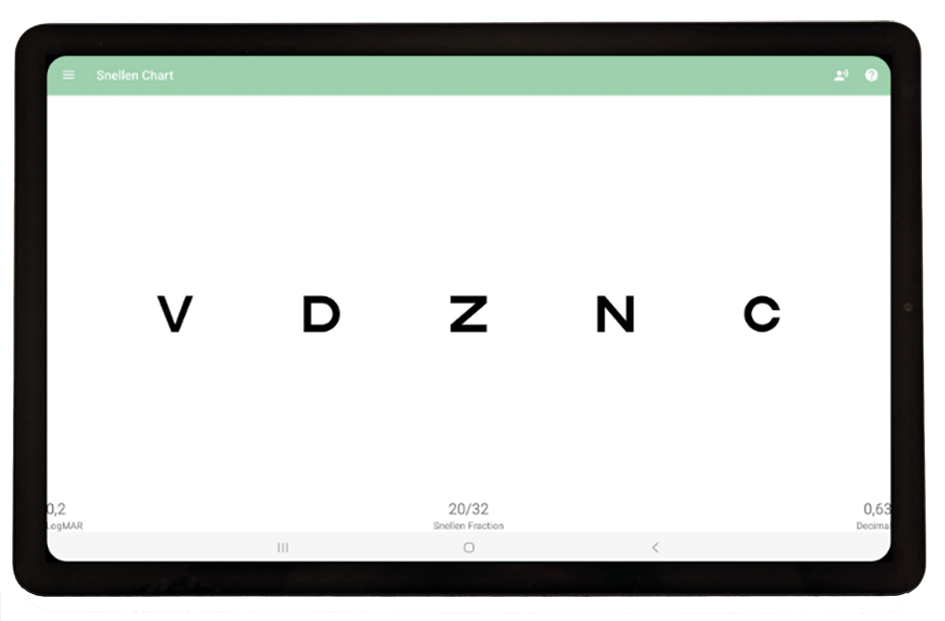
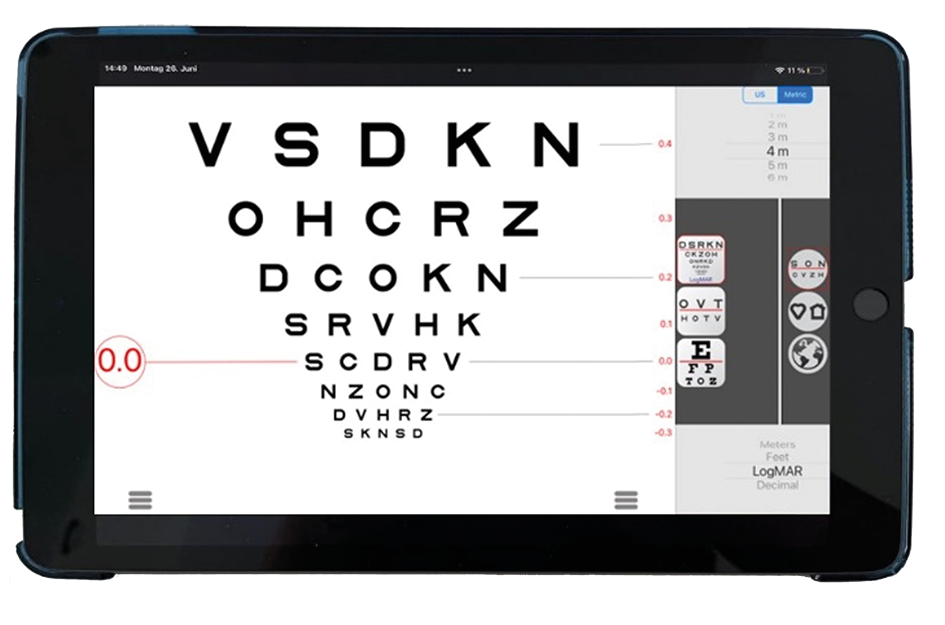
The Konan Acuity application was selected for the iOS operating system and the Snellen chart application for the Android operating system. Both app designs resemble in many respects the specifications of the DIN standards. The Konan Acuity app was installed on an Apple iPad (9th generation, 10-inch screen diagonal) and the Snellen chart app on a Samsung Galaxy Tab S6 lite (10-inch screen diagonal). Before conducting the measurements, the test distance for the screen resolution required by DIN EN ISO 10938 3 was tested which was achieved at a distance of ≥ 133 cm for the iPad and at a distance of ≥ 155 cm for the Samsung Galaxy Tab. At a test distance of 4 m, the pixel size is 0.083‘ for the iPad and 0.097‘ for the Samsung Galaxy Tab. From a distance of 40 cm, typical for determining near vision acuity, a pixel on the tablets would appear 3-4 times larger than permitted by the standard. The optotypes used in the respective app were also checked for compliance with the DIN standard in terms of their dimensions and their distance from each other. The optotype sizes are within the standard specified by the DIN. The distances between the individual optotypes of the Konan Acuity app are each the size of an optotype, as it is the case with the ETDRS charts. With the Snellen chart app, the minimum distances required by DIN EN ISO 8596 are only matched at visual acuity level 0.5 or
higher.1 (Figure 1)
The ETDRS charts with letters and Landolt rings in four orientations, known from many scientific studies, were used as the standard procedure. ETDRS charts display several logarithmically decreasing rows with five optotypes per row. As the distances between the optotypes also decrease logarithmically row by row, the visual requirements are the same for all visual acuity levels and the visual acuity can be recorded letter by letter.
The visual acuity measurements were carried out in a room illuminated with artificial daylight. Before conducting the measurements, the test field luminance was adjusted to approx. 200 cd/m², which is the value specified in the DIN EN ISO 10938, with the aid of a luminance meter (LS-100, Konica Minolta). The luminance of the ETDRS charts was adjusted using dimmable and diffuse LED lights and the luminance of the tablet PCs was adjusted by manually controlling the background luminance. The luminance of individual optotypes was measured using a close-up lens on the luminance meter and it was ensured that it did not exceed 15 % of the background luminance.
The eye to be examined was randomly chosen for each subject, the refraction was determined subjectively using the cross-cylinder method and the trial lenses were then left in the trial frame before visual acuity was determined. Visual acuity was determined using the ETDRS charts and the two applications one after another, whereby letters (B) or Landolt rings in four orientations (L) were presented in random order and at a test distance of 4 metres. For each measurement condition, one measurement was carried out with full correction (0), with a fogging lens of +0.50 D (0.5) and with a fogging lens of +1.00 D (1.0), resulting in a total of 18 measurements per subject. The fogging was intended to simulate a reduction in visual acuity due to a refractive error in order to be able to assess the suitability of the apps over a larger visual acuity range. In order to prevent a memory effect, for each measurement condition, visual acuity was first determined with the +1.00 D fogging lens and finally without the fogging lens. The test subjects were asked to name the optotypes according to the forced choice method until no optotype within a visual acuity level could be named correctly anymore. The measured value for visual acuity resulted from the logMAR for the smallest row in which at least 60 % of the optotypes were named correctly, whereby 0.02 was subtrated or added for each additional optotype identified or misidentified.
In the second part of the study, the visual acuity determination was repeated for screen brightness levels of approx. 80 cd/m² and approx. 370 cd/m² on six subjects from the main part of the study. These brightness levels represent the lower and upper limits of the test field luminance allowed and correspond to a medium and the maximum screen brightness of the Samsung Galaxy Tab S6 lite used here. The visual acuity values determined with the Snellen chart app on Landolt rings presented in four opening directions were compared with the corresponding visual acuity values from the main part of the study (Snellen chart app with Landolt rings; screen brightness approx. 200 cd/m²).
The series of measurements in the main study were tested for normal distribution using the Shapiro-Wilk test and compared with each other using the t-test for paired samples. The differences in measured values for the different screen brightness levels, on the other hand, were only compared descriptively.
Results
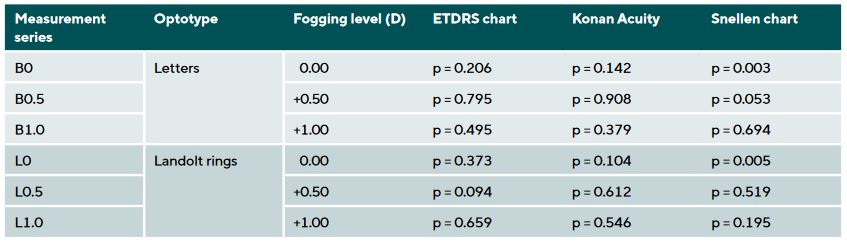
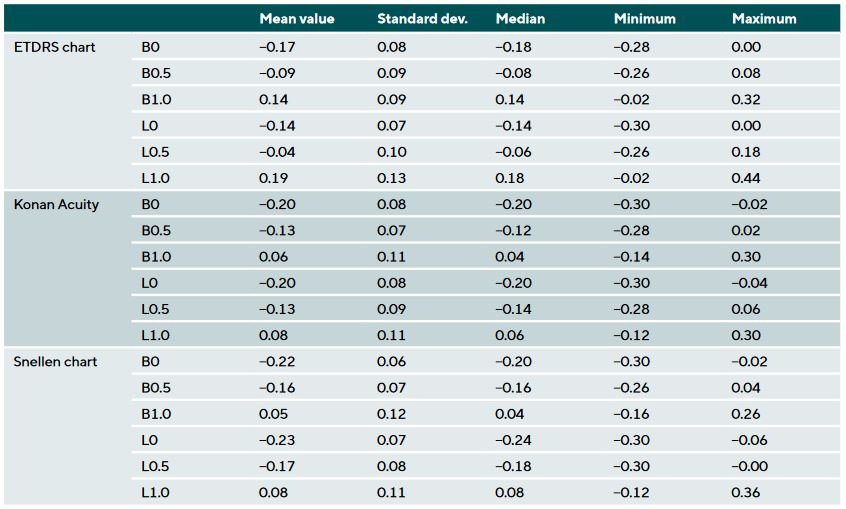
Table 1 shows the p-values for the test for normal distribution (Shapiro-Wilk test), which can be assumed for most of the measurement series of the same kind (16 of 18). Table 2 provides a brief description of the statistical key figures for the individual samples in the study.
Comparing the visual acuity apps with the ETDRS charts
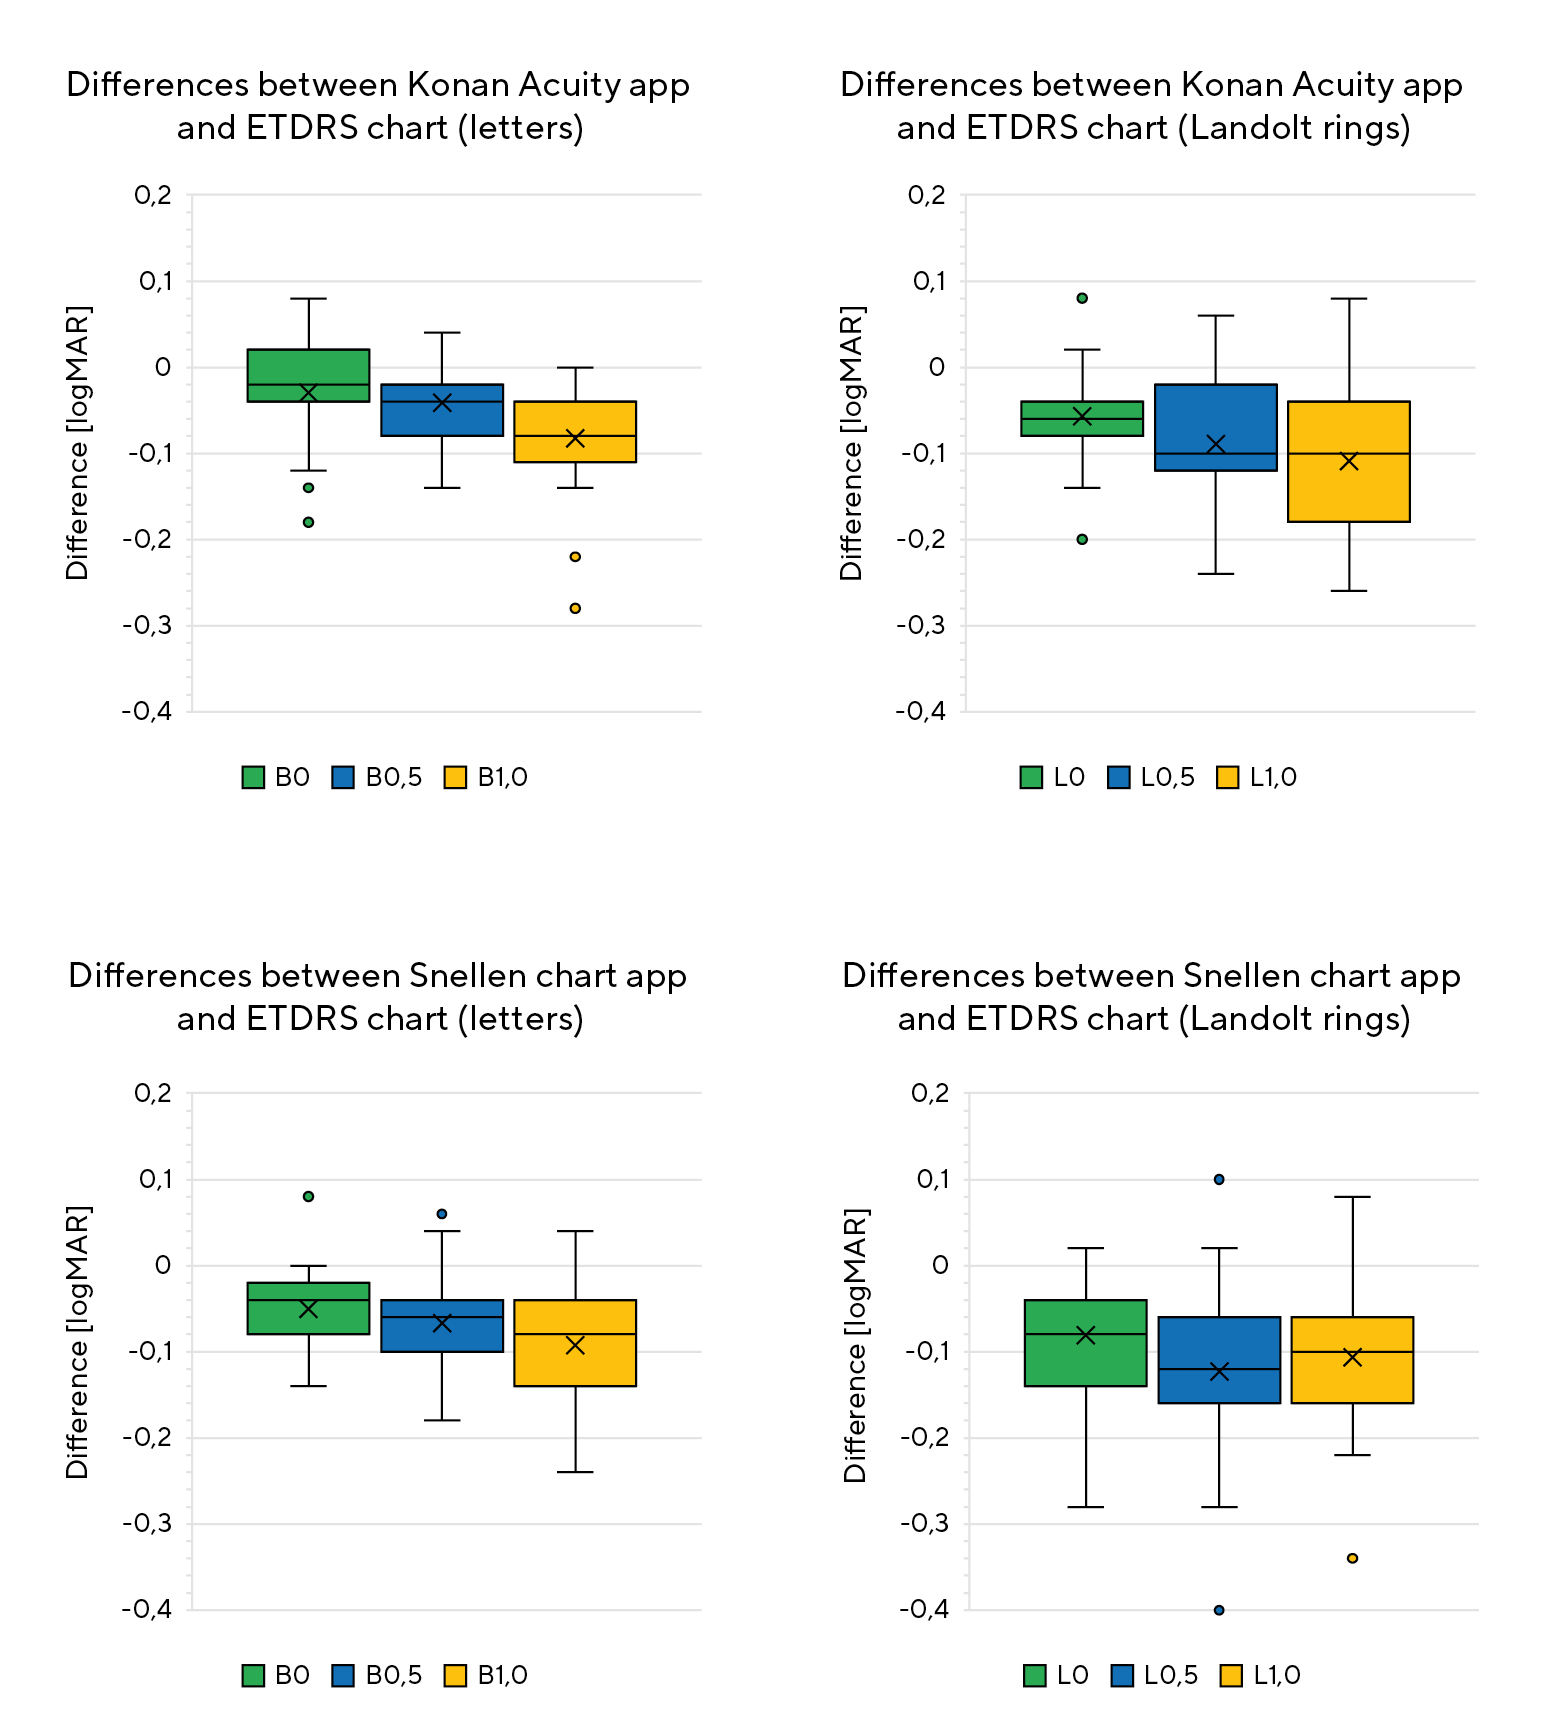
Figure 2 shows the position and spread of the differences between the respective app and the corresponding ETDRS chart. Table 3 shows the significances for the differences in the measured values determined using the t-test for paired samples. The t-test was applied equally to all samples because they can be regarded as predominantly normally distributed and of the same kind due to the very similar test conditions. It showed that all measurement series differed either significantly (p < 0.05) or highly significantly (p < 0.001) from the measured values determined with the ETDRS charts. The mean differences tend to increase with the increase in fogging or the decrease in visual acuity. The invariably negative differences indicate that the logMAR values determined with the app are consistently more negative than the measured values determined with the charts or that, on average, a better visual acuity was determined with the apps than with the charts. The outliers determined for some samples are within 3 times the interquartile range (IQR), which is why the measured values in question were considered and included in the statistics.
Influence of screen brightness
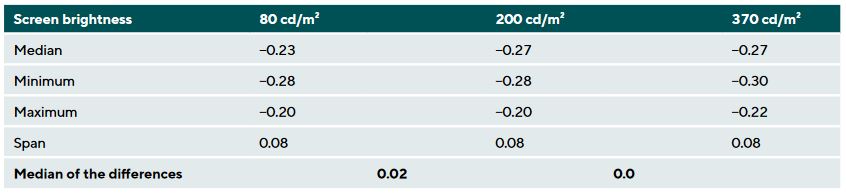
Table 4 shows the statistical key figures for the influence of screen brightness on visual acuity. The difference between the screen brightness of 80 cd/m2 and the screen brightness of 200 cd/m2 showed a median of 0.02 and the difference between the screen brightness of 370 cd/m2 and the screen brightness of 200 cd/m2 had a median of 0.00 logMAR.
Discussion
Comparing the visual acuity apps with the ETDRS charts
The aim of the study is to examine whether selected applications installed on a tablet PC are suitable for the clinical determination of visual acuity. Such suitability is considered here if the framework conditions regulated in the DIN EN ISO standards are met and if the average measured visual acuity differs ≤ 0.05 logMAR from the visual acuity measured with a conventional visual acuity chart.8
We checked the dimensions of the optotypes displayed by both applications before starting the measurements. In both cases, the deviations for the overall height and for the gap width or line width were below the 5 % allowed by DIN EN ISO 8596.1 In this regard, it can be assumed that the dimensions of the optotypes conform to the standard. In contrast, the application tested by Perera et al. and installed on an Apple iPhone, for example, showed average deviations of 6.6 %.6
The t-test analysis shows highly significant differences in most cases when comparing both applications with the ETDRS charts. On average, both applications measured better visual acuity compared to the charts. When using letters, an average of 1.5 more letters were read from a row of five characters (−0.03 logMAR) with full correction using the Konan Acuity app. The average deviation from the ETDRS chart increases to two or even four letters when fogging lenses of varying power were used. The visual acuity values obtained with both apps using Landolt rings differ even more from ETDRS chart than the values determined with the apps using letters, for almost all measurement conditions (see Figure 2 and Table 3).
The Snellen chart application shows slightly higher differences to the ETDRS charts than the Konan Acuity application across almost all measurement conditions. Under full correction, an average of 2.5 letters (−0.05 logMAR) more were read with the app than on the chart, but only 1 letter more (0.02) than with the Konan Acuity app. When using Landolt rings and fogging lenses, the difference to the corresponding visual acuity chart increases, but the difference to the Konan Acuity app remains comparatively small.
According to ISO/TR 19498, two sets of optotypes are considered to be equivalent if the visual acuity differs on average by a maximum of 0.05 logMAR and the standard deviation of the visual acuity of the tested optotype is not more than 1.5 times the standard deviation of the visual acuity of the Landolt rings.8 In relation to the present study, this means that all differences up to 0.05 logMAR found between any two conditions of can be considered equivalent. Paragraph 6 of ISO/TR 19498 also addresses the significance of the differences, which can be determined using the equations described there.8 When applied to this study, it can be seen that the differences between the B0 samples of both apps do not exceed 0.05 logMAR and the standard deviations are also within the 1.5 times limit. Only when comparing the Konan Acuity app with the ETDRS chart with letters and full correction the p-value is above the 5 % significance level; all other differences are therefore to be regarded as statistically significant. It should be noted that the conditions specified in the ISO/TR are intended to serve as a reference for this study but cannot be fully implemented. ISO/TR 19498 describes a procedure for comparing optotype with the standard visual acuity sign: the Landolt ring. Each optotype must be presented 120 times to every test subject which would have exceeded the intention and the time frame of this study by far. Furthermore, the study is intended to compare two apps against the popular ETRS charts containing the same optotypes, and not so much to compare indivdual optotypes against the standard Landolt ring. In addition, it should be noted that this study considers differences averaged across several test subjects and not differences averaged across repeated measurements on one and the same eye. In conclusion, it can be said that, when using capital letters for eyes with high and with fully corrected vision, the apps are comparable to the ETDRS charts, and the differences can be regarded as tolerable.
Ansell et al. and Perera et al. carried out similar comparisons of visual acuity apps with classic ETDRS and Snellen charts.5,6 With an average deviation of 0.02 logMAR, Ansell et al. found no significant differences between the app and the ETDRS chart. As the study was only conducted on young, healthy adults, they recommend further studies on eyes with pathologically impaired visual acuity,5 which also applies to the present study. Perera et al. tested an application to determine visual acuity on test subjects with significant differences in visual acuity and found that the differences between the app and the chart increase with poor visual acuity but are not significant on average. The authors came to the conclusion that the app does not provide reliable results, but presumed that professional examiners would probably make similar decisions regarding the care of the patients when using conventional methods.6 The study by Black et al. also shows comparable results between an app and a conventional vision test chart, although the authors note that the lighting conditions and screen reflections must be taken into account when using mobile devices.7 These limitations can be countered, for example, by indirect and diffuse room lighting and by avoiding natural daylight or at least direct sunlight.
In broad agreement with the authors cited above, the present study also draws the conclusion that applications installed on mobile devices can provide comparable results to standardised vision test charts. Although the differences found in this study can be categorised as predominantly statistically significant, they can be regarded as tolerable in practice under certain circumstances, as they only amount to a few letters on a logarithmically decreasing visual acuity chart. More significant differences are to be expected when using Landolt rings with four orientations and when the visual performance of a patient is reduced due to refractive errors, although this cannot necessarily be equated with reduced visual acuity due to pathological changes. Further studies on test subjects with pathologically reduced visual acuity are required here.
A systematic error must be taken into consideration since the logMAR values determined with the two applications under different conditions were, without exception, significantly more negative than the logMAR values determined on the ETDRS charts (Table 3). This may be primarily due to the way in which the optotypes are presented. For example, the structure of the Snellen chart app is – as its name indicates – based on the Snellen charts. With increasing visual acuity, the distance between the optotypes increases; from decimal visual acuity level 0.5 in accordance with DIN EN ISO 8596, but below this level, the distances are below the standard. Compared to the ETDRS charts and the Konan Acuity app, this could lead to differences in contour interaction (crowding phenomenon) and therefore to higher visual acuity.9 In addition, the Snellen chart app only displays one isolated visual acuity row per visual acuity level, whereas the Konan Acuity app and the ETDRS charts display several optotype rows for several visual acuity levels simultaneously, which can also lead to differences in contour interaction. This assumption is reinforced by the fact that some test subjects reported difficulties in „not slipping between the rows“ with both the ETDRS charts and the Konan Acuity app. Another reason could be the lack of randomisation for the sequence of the charts and apps tested in this study (see Material and Methods section), which could have resulted in a certain training effect and hence in better visual acuity values for the apps. A possible explanation for the greater differences when using Landolt rings is less conclusive (differences to the chart up to 0.05 higher than with letters, see Table 3). Here, it can only be conjectured that presenting Landolt rings in only four instead of eight orientations increases the guessing probability and hence the measured visual acuity.
The apps analysed here are not suitable for creating expert reports or for scientific use, as some of the relevant standards cannot be met. Firstly, the Landolt ring is presented in only four instead of eight orientations, and secondly, the test field of a 10-inch tablet PC at a test distance of at least 4 m is too small to ensure the required distance of at least 0.5° between the edge of the screen and the outer edge of the optotypes. Depending on their screen resolution, tablet-PCs cannot be used to determine near visual acuity. Furthermore, contrast, resolution, background luminance and test distance are often more difficult to control and less often standardised with mobile devices than with conventional vision testing devices.
Influence of screen brightness on visual acuity
Table 3 shows that the visual acuity values determined at different screen brightness levels (80, 200 and 370 cd/m2) do not differ or differ only very slightly. For example, the difference of 0.02 found at the low brightness setting only corresponds to the visual acuity value of one letter on a logMAR chart and can be easily regarded as a random error. It can therefore be concluded that the screen brightness has no or at most a very small influence as long as it does not exceed the limits allowed in the corresponding DIN EN ISO. Similar findings have also been reported by other authors. Sheedy et al., for example, investigated visual acuity in a luminance range between 45 and 563 cd/m2 and found that, on average, only one letter more is read or there is no difference at all when doubling the luminance, provided Landolt rings are used as optotypes.10
However, it must be pointed out that no statistical significance test was carried out here due to the small sample size and the results should therefore only be regarded as a tendency.
Conclusion
In young adults with a visual acuity of ≥ 1.0 the use of the Konan Acuity app and the Snellen chart app on a tablet PC results in visual acuity values similar to those obtained with conventional ETDRS charts, when letters are used as optotypes. If visual acuity is reduced due to refractive errors and if Landolt rings are used, there are differences compared to the ETDRS chart that must be considered inacceptable in the sense defined here. However, in a clinical setting the differences appear to be accetable because they are small or at least remain within one line on a visual acuity chart and hence may not influence clinical decisions significantly. The applications used here determine a more negative logMAR on average or a higher visual acuity, which can result in deviations of up to a whole visual acuity level depending on the (simulated) visual acuity reduction. Possible causes for such deviations include different distances between the optotypes and the associated influence of contour interaction. Using both the Konan acuity and the Snellen chart app under clinical conditions is furthermore conceivable, because they provide a high-quality and standardised presentation of optotypes. However the end devices used in this study allow screen settings within the permissible brightness and contrast limits. The applications examined here are unsuitable for expert reports or scientific purposes, as either they or the end device do not fulfil all the conditions required by the current standard for visual acuity determination. The suitability of such apps for everyday clinical use should be further investigated under conditions that are as close to real-life conditions as possible. This should include, for example, tests on eyes with pathologically reduced visual acuity. Furthermore, the repeatability of app-based visual acuity measurements should be investigated in more detail.
Conflict of interest
The authors have no conflict of interest regarding the methods and devices mentioned in the article. Rebecca Velmans and Kathi Savioli contributed equally to the planning and realisation of the study as well as in the preparation of the manuscript.

About Rebecca Velmans
B.Sc. Augenoptik/Optometrie - Augen-Tagesklinik Groß Pankow, Groß Pankow, Germany
COE Multiple Choice Questionnaire
The publication "Validation of selected tablet apps for determining visual acuity" has been approved as a COE continuing education article by the German Quality Association for Optometric Services (GOL). The deadline to answer the questions is 1st June 2025. Only one answer per question is correct. Successful completion requires answering four of the six questions.
You can take the continuing education exam while logged in.
Users who are not yet logged in can register for ocl-online free of charge here.